How good is your logging provider’s search experience? Now, you can leverage the same set of services that power search on Facebook, eBay and tons of other websites to index and query the logs of your Service Fabric applications. Let’s discuss how you can integrate ElasticSearch with your Service Fabric application to index and query the diagnostic logs generated by your application.
Before we set out to discuss ElasticSearch and Service Fabric integration, I would like to call out that you can build an ElasticSearch listener for your WebApps as well (even for those that are built with .net core). Now let’s start building a Service Fabric application that reports logs to an ElasticSearch cluster.
What is ElasticSearch?
ElasticSearch is a distributed, RESTful search and analytics engine that can analyze big volumes of data in near real time (because there is an indexing delay of about a second). ElasticSearch also exposes a REST API through which you can index data and make it available for analysis. You don’t need to get your hands dirty with sending and receiving HTTP requests though, as there are two APIs, named Elastic.net and NEST, available for integration in your .net applications. ElasticSearch is available on Azure Marketplace, which you can purchase and deploy on your own cluster of VMs. It is also available as an installer package, which you can use to host it on your laptop or your local data center.
Kibana is an open-source analytics and visualization platform. The data that ElasticSearch indexes can be discovered and visualized with Kibana. The ElasticSearch template on Azure Marketplace comes bundled with Kibana and you only need to enable the option to deploy Kibana to your cluster.
ElasticSearch Cluster
ElasticSearch cluster uses sharding to distribute data across multiple nodes. The data is replicated to ensure high availability. ElasticSearch stores documents in indexes and uses them to locate documents. The ElasticSearch nodes are categorized by the roles that they fulfill, which are as follows.
- A data node which can hold one or more shards that contain index data. It houses all the data and does not service any query requests.
- A client node that does not hold index data, but that handles incoming requests made by the client applications by routing them to the appropriate data node.
- A master node that does not hold index data, but performs cluster management operations, such as maintaining and distributing routing information around the cluster (the list of which nodes contain which shards), determining which nodes are available, relocating shards as nodes appear and disappear, and coordinating recovery after node failure. Multiple nodes can be configured as masters, but only one will actually be elected to perform the master functions. If this node fails, another election takes place and one of the other eligible master nodes will be elected to take over.
Provisioning ElasticSearch Cluster on Azure
You can provision an elasticsearch cluster on Azure using ARM template or Azure Marketplace. The ARM template to provision an ElasticSearch and Kibana cluster is available in Azure quick start templates repo here (a note about it is at the end of this post). Let’s provision an ElasticSearch cluster using the Azure Marketplace template to go through the various configuration options.
In Azure Management Portal, search for the term elasticsearch.
On the search results page, select the ElasticSearch and Kibana entry.
Click on Create button to start provisioning the ElasticSearch cluster.
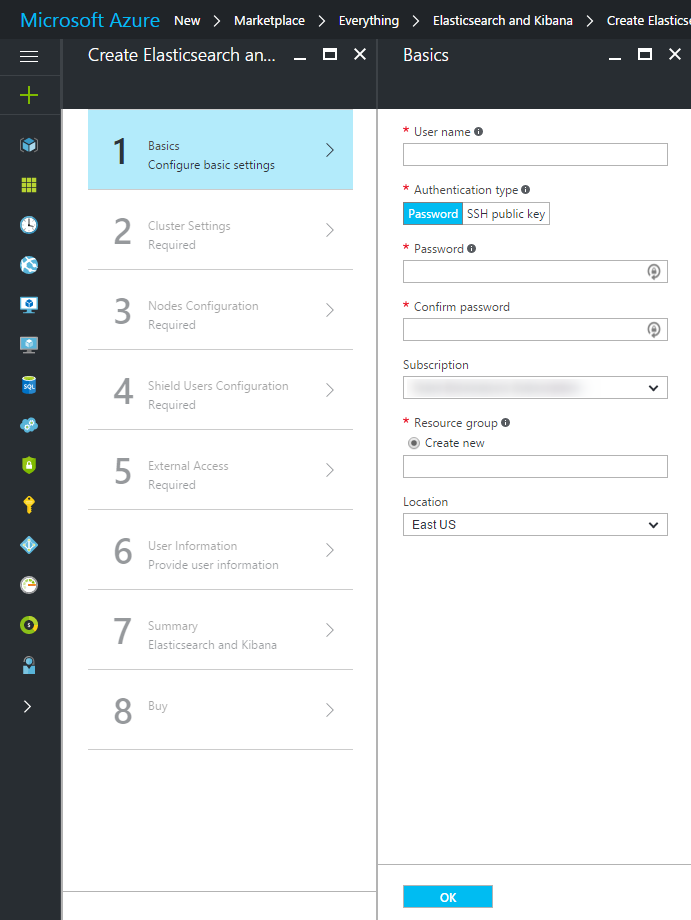
Create ElasticSearch Cluster Options Fill the details required to provision the cluster. Let’s start with the Basic Settings.
Parameter Name Value User Name The username for accessing VMs on the cluster. Authentication Type Password or SSH Key. Use password for the sample. Password The password. Subscription Azure subscription to use. Resource Group Resource group that will hold the ElasticSearch cluster. Location Choose the region where your ElasticSearch cluster should be deployed. Cluster Settings.
Parameter Name Value ElasticSearch Version Let it be set at its default value unless you want to target a specific version. Cluster Name Name of your ElasticSearch cluster. Nodes Configuration
Leave all the default values intact here. An ElasticSearch cluster can have a number nodes as described above. For this demo, set the Data Nodes are Master Eligible option to Yes. This will enable a data node to be elected as the master node, thus reducing the number of nodes to be deployed. By default, no client nodes are provisioned.
Security\Shield
Security\Shield is an ElasticSearch plugin that enables you to secure the ElasticSearch cluster. Shield provides authentication and Role Based Access Control (RBAC) on your ElasticSearch cluster. In this section, set up passwords for three users: es_admin which is the cluster administrator, es_read which is a read-only user that doesn’t have write access and es_kibana which is the administrator for Kibana UI.
Extended Access
Parameter Name Value Install Kibana Yes. Use a Jump Box No. This option adds a VM to the deployment that you can use to connect to other VMs in the cluster. Load Balancer Type External. Provide organizational details, review the summary and allow the ElasticSearch cluster to be provisioned.
Click on the Resource Group of the ElasticSearch cluster that you just provisioned and locate the Load Balancer Public IP resource. Note the IP address of the ElasticSearch cluster. We will use this address to send requests to the cluster. You may create a DNS record for the public IP by clicking on All Settings link and adding a DNS name label in the configuration blade.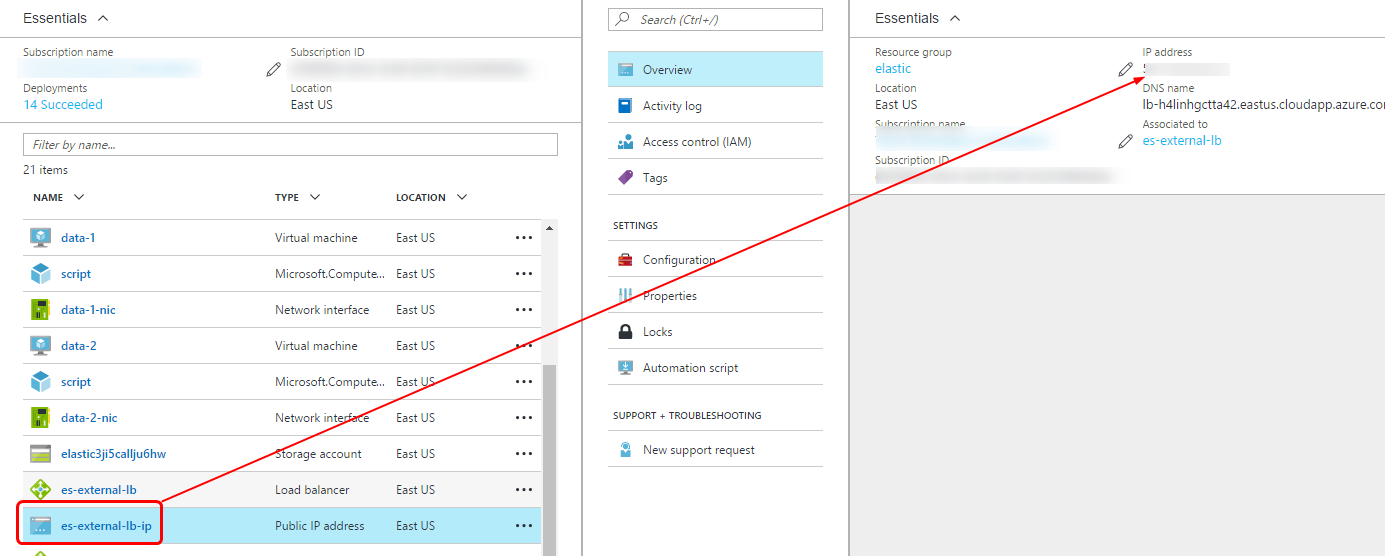
Provisioning Kibana
The template that we used to provision the ElasticSearch cluster, also provisions Kibana for us. However, to make the Kibana instance talk to the cluster we need to modify the Kibana settings.
If you are using Windows OS, install PuTTY, which is an SSH and telnet client for Windows.
Locate the IP address of the Kibana VM in your resources.
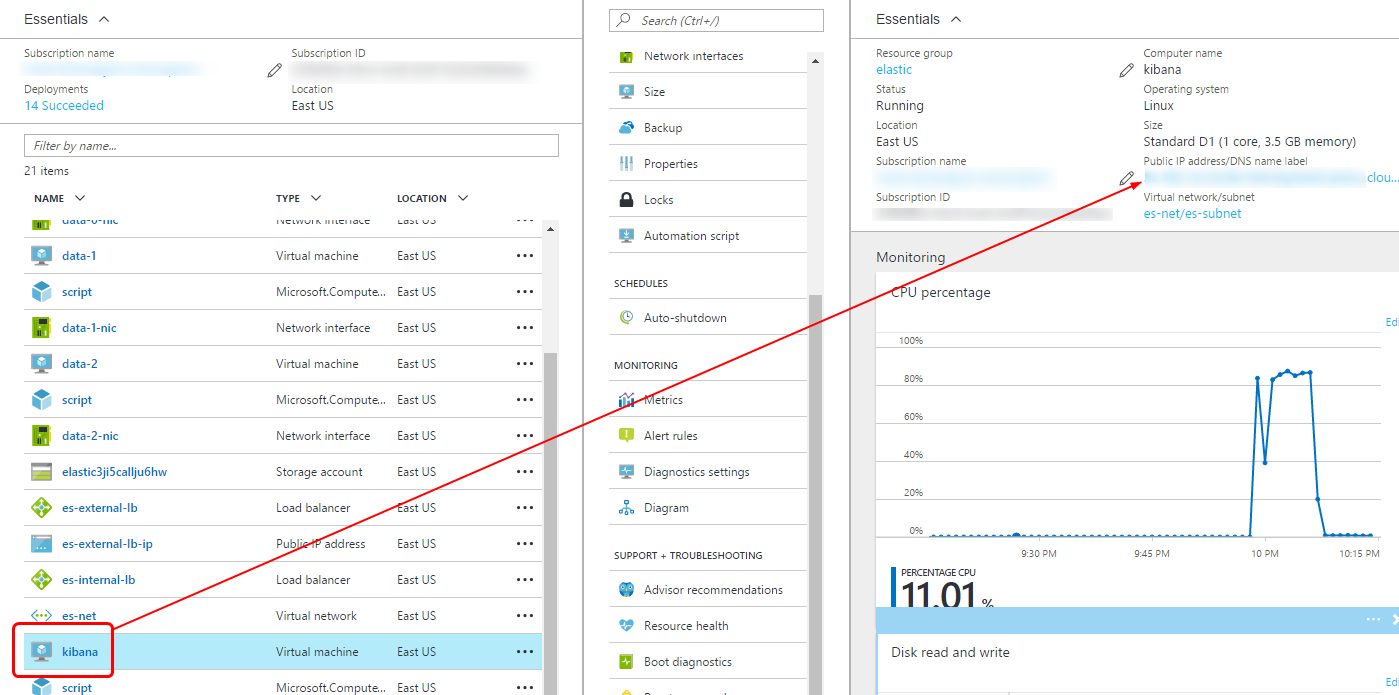
Kibana VM IP Address Use PuTTY to SSH into your Kibana VM and edit the /opt/kibana/config/kibana.yml file to make the following changes and while leaving out the rest of the configurations intact:
elasticsearch.url: "http://[elasticsearch cluster ip address]:9200"
elasticsearch.username: es_admin
elasticsearch.password: "[es_admin password]"
The kibana.yml file is a read only file, so you may need to force write it. See the command that you can use for the purpose here.
Reboot the Kibana VM with the following command to allow Kibana to pick up the new configuration values:
sudo rebootYou should now be able to access the Kibana UI at “http://[IP of Kibana VM]:5601/”. Use your es_kibana credentials to login.
Pump Logs to ElasticSearch
If you don’t want to follow the steps outlined below, I have already done the work for you. Simply download\clone the application here.
I post all my samples in GitHub, you can follow my activity on GitHub to see what I am up to 😄
Create a new Service Fabric application and add a stateless service to it.
Navigate to the Party Cluster Sample on GitHub.
Add the
ElasticSearchListenerclass and all its dependencies in your project.Add the Microsoft.Diagnostics.Tracing.EventSource nuget to the solution.
In the
ServiceEventSourceclass, replace the using statementusing System.Diagnostics.Tracing;with
using Microsoft.Diagnostics.Tracing;In the Program.cs file, add the following code to the
Mainmethod to enable theElasticSearchListener.const string EventListenerId = "ElasticSearchEventListener"; FabricConfigurationProvider configurationProvider = new FabricConfigurationProvider(EventListenerId); ElasticSearchListener listener = null; if (configurationProvider.HasConfiguration) { listener = new ElasticSearchListener(configurationProvider, new FabricHealthReporter(EventListenerId)); } try { // The remaining code intact... // ... Thread.Sleep(Timeout.Infinite); GC.KeepAlive(listener); }In the PackageRoot/Config/Settings.xml file, add the necessary configurations required to connect to your ElasticSearch cluster.
<Section Name="ElasticSearchEventListener">
<Parameter Name="serviceUri" Value="http://ES Cluster IP:9200/"/>
<Parameter Name="userName" Value="es_admin"/>
<Parameter Name="password" Value="es_admin password"/>
<Parameter Name="indexNamePrefix" Value="name of index prefix"/>
</Section>
Press F5 and let the service generate logs for some time.
Output
Login to the Kibana console and you will find your custom index present among the other indexes in the system.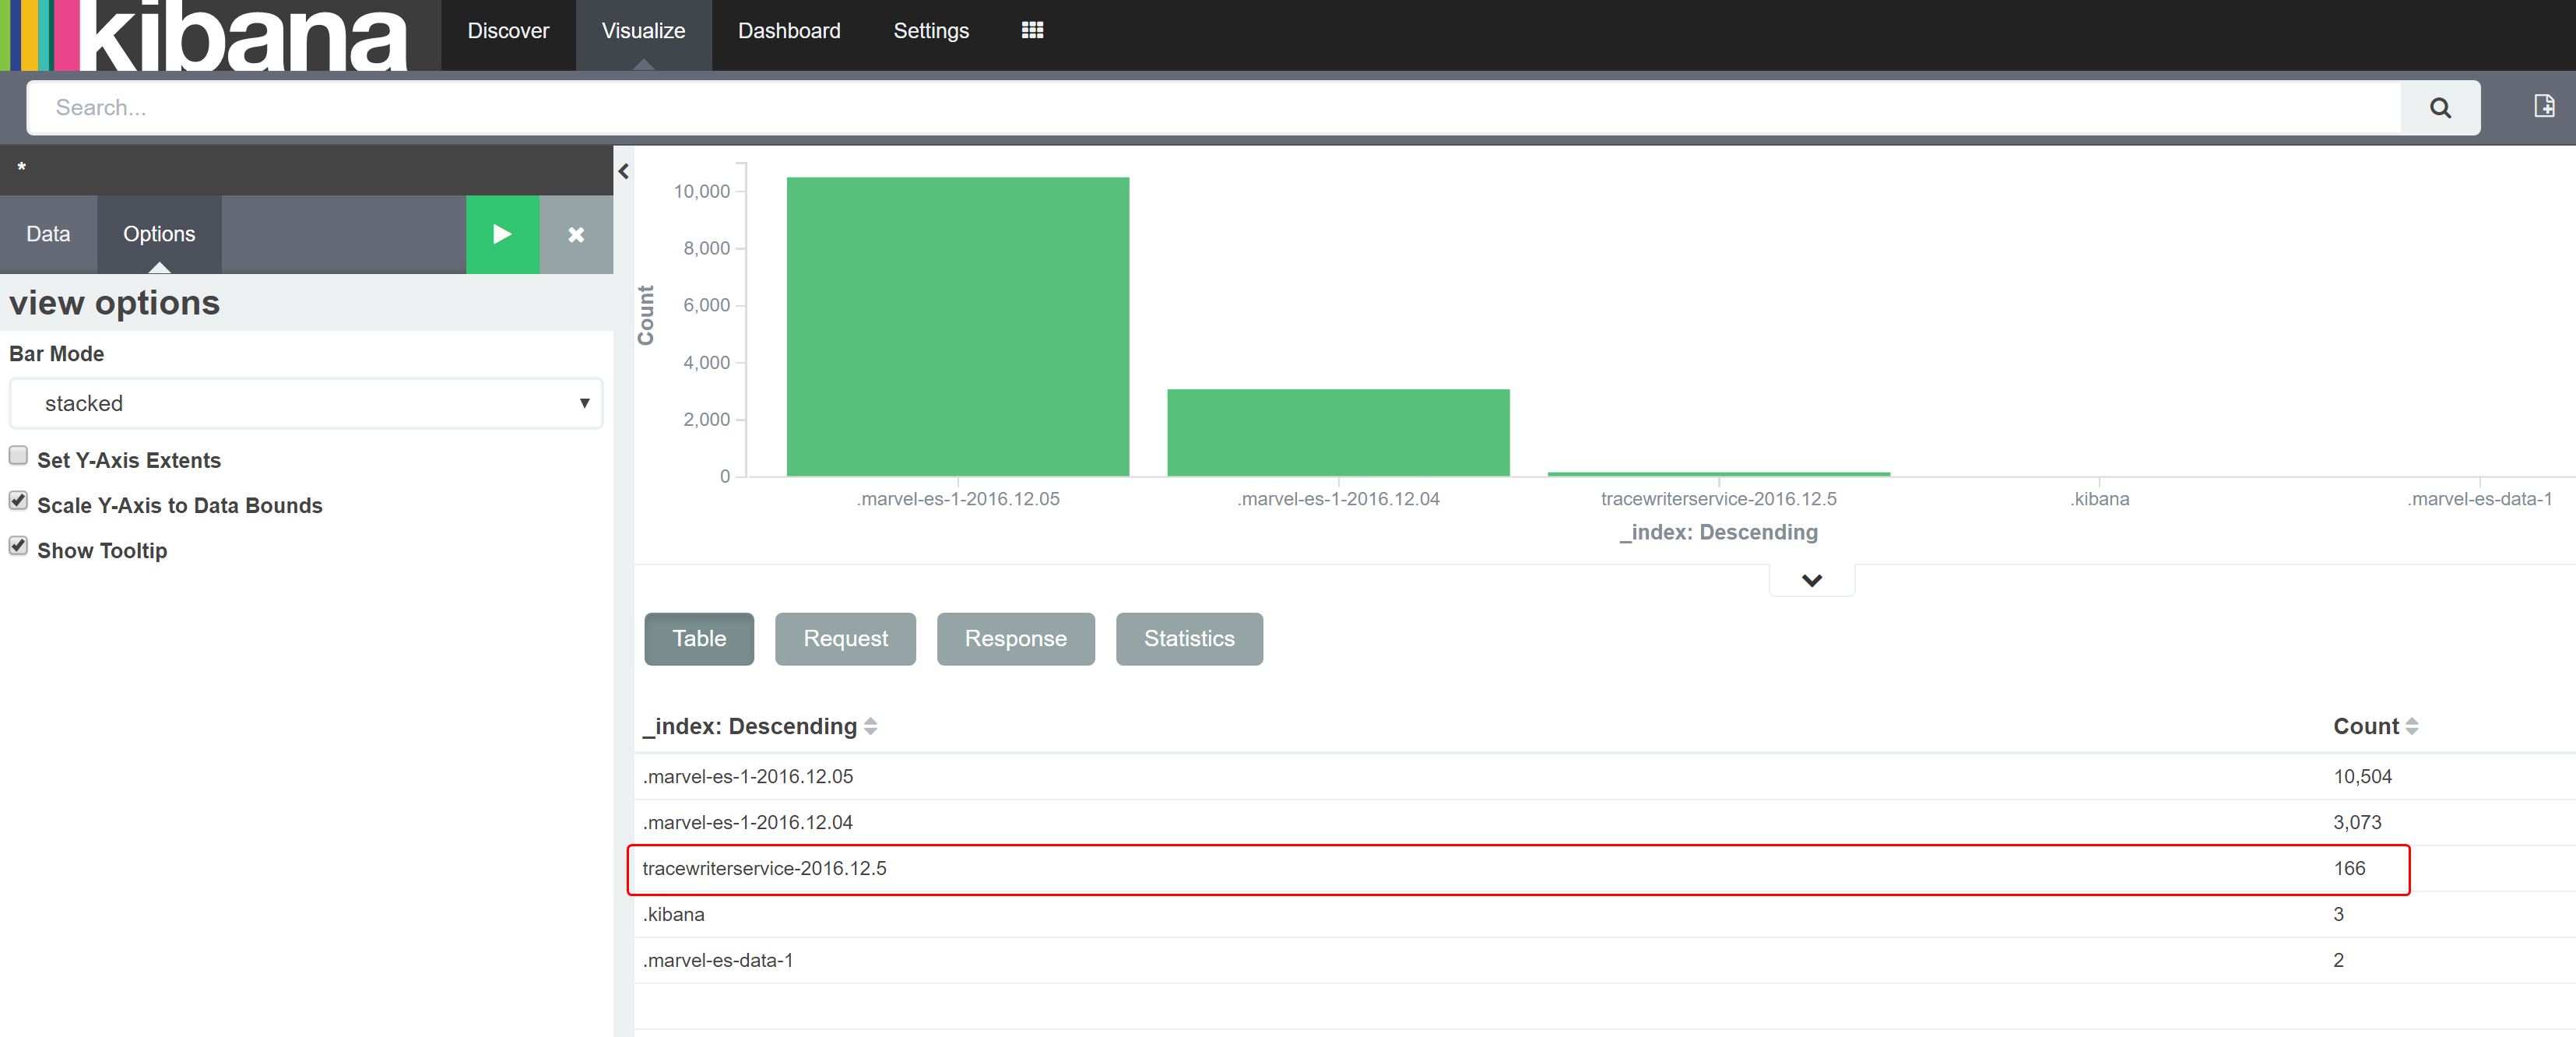
Next, let’s search for logs containing a specific message in the heap of logs indexed by ElasticSearch.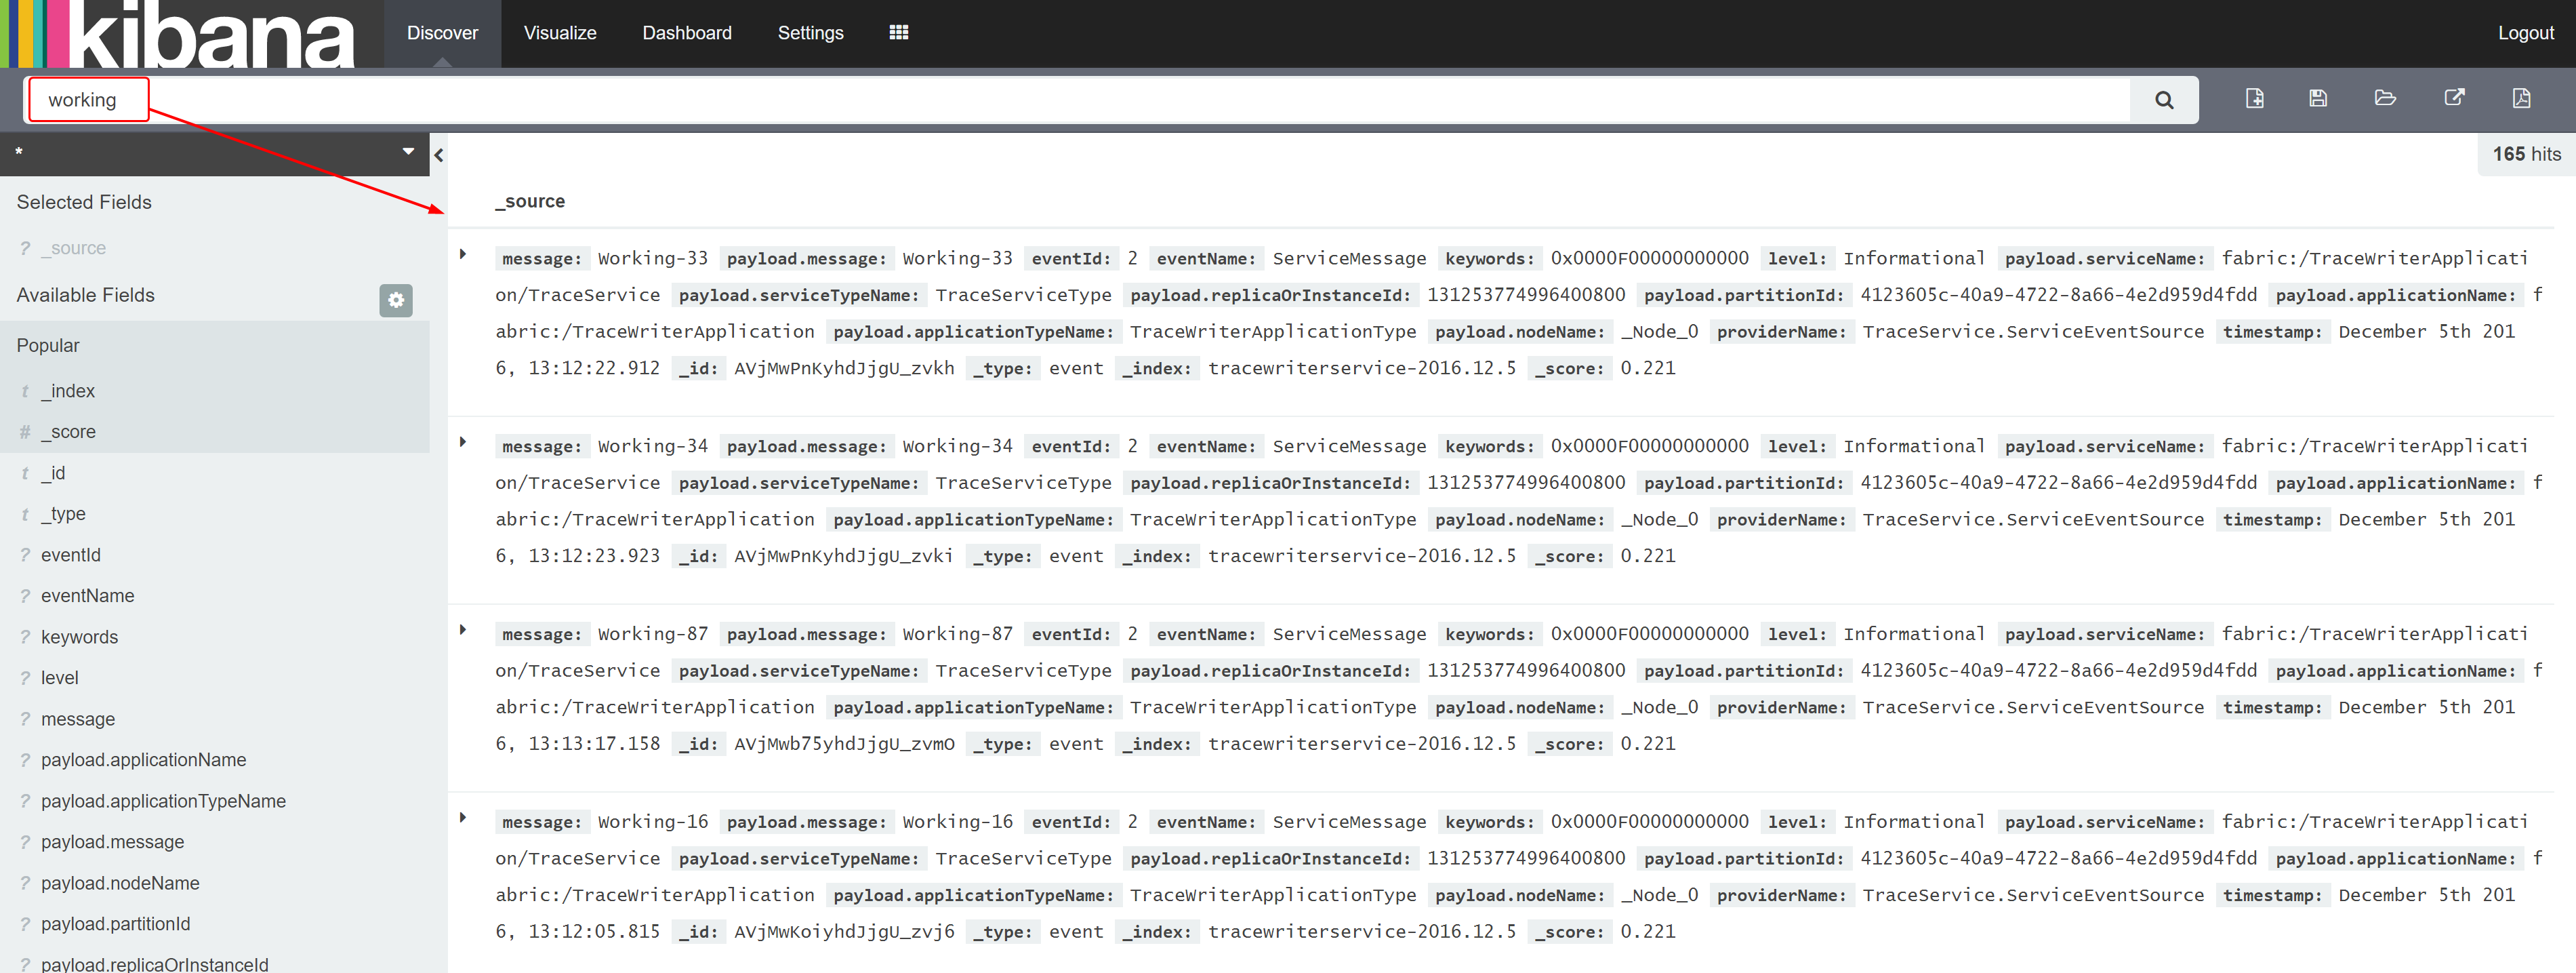
There are several other plugins and management options available for ElasticSearch. If you want to explore those in detail, visit the elastic.co website.
Russ Cam pointed out the differences in deploying the cluster through ARM template (the recommended approach) and through Marketplace:
- With the ARM template, you don’t need to ssh into the Kibana VM to change the configuration; when you specify to use an external load balancer, an internal load balancer resource is also deployed and Kibana is configured to use this to communicate with the cluster. IP tables port forwarding rules are set up to allow two different load balancers (internal and external) to communicate with the cluster on different backend ports.
- The deployment of the internal load balancer for the Kibana VM to use happens whether you deploy an Elasticsearch cluster through the Azure Marketplace or through using the ARM template directly with command line tooling. The Azure Marketplace UI calls the ARM template at the end of the step process, passing it all of the parameters specified in the UI.
- The ARM template also does not (currently) configure SSL/TLS, so it is recommended to set this up too.
Did you enjoy reading this article? I can notify you the next time I publish on this blog... ✍