Imagine running a .NET Core application in Kubernetes, which suddenly starts being sluggish, and the telemetry fails to give you a complete picture of the issue. To remediate performance issues of applications, starting with .NET Core 3, Microsoft introduced several .NET Core runtime diagnostics tools to diagnose application issues.
- dotnet-counters to view Performance Counters.
- dotnet-dump to capture and analyze Dumps.
- dotnet-trace to capture runtime events and sample CPU stacks.
- dotnet-gcdump to collect Garbage Collector dumps of application.
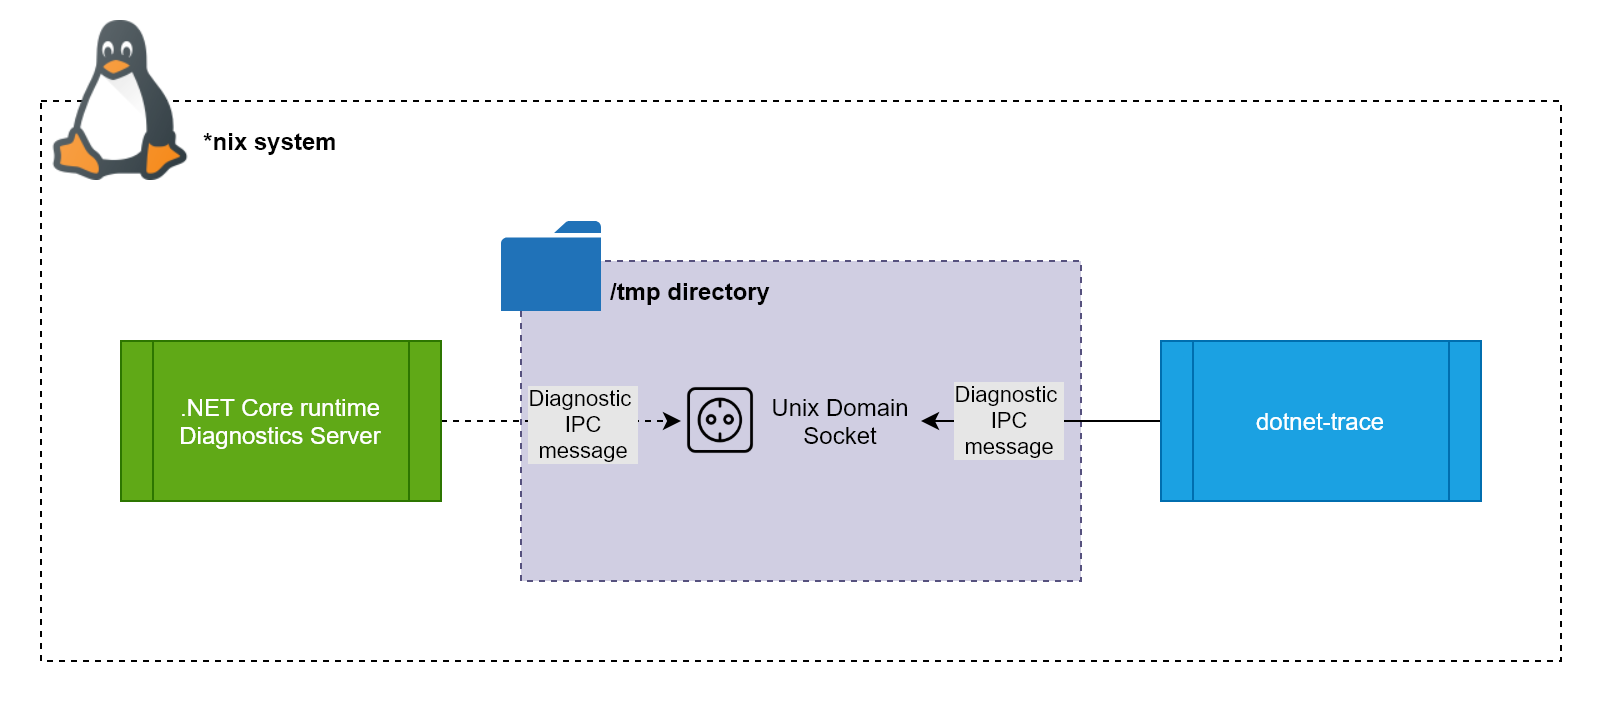
Let’s try to understand how these tools work. The .NET Core (3.0+) runtime contains a Diagnostic Server that sends and receives application diagnostic data. The Diagnostic Server opens an IPC (Interprocess communication) channel through which a client (dotnet tool) can communicate. The channel used for communication varies with the platform: Unix Domain Sockets on *nix systems and Named Pipes on Windows. On Linux, the Unix Domain Socket is placed in the /tmp directory by default. The following diagram presents the components involved in the communication between the Diagnostic Server and the client:
Running the diagnostics tools on your local system or on an application server where you can install the tools is very easy. If you are running your application on containers, you can still use these tools by following the prescribed guidance in the Microsoft documentation.
There are two approaches to using the diagnostics tools with containerized .NET Core applications as follows:
- Install the tools in the same container as the application.
- Install the tools in a sidecar container.
If you install the tools with your application in the same container, you will bloat the size of the image. Also, every update of the tools will require an update of the application image. The limitations of the first approach make the second approach of using a sidecar a preferred option.
A sidecar is a container that runs on the same Pod as your application’s container. Since it shares the same volume and network as the application’s container, it can enhance how the application operates. The most common use cases of sidecar containers are for running log shippers and monitoring agents.
Armed with the understanding of the diagnostics tools, let’s discuss the problem we will attempt to resolve.
The Problem
We need to address the following three issues to successfully connect the diagnostics tools sidecar with the application container and collect the necessary data.
- Accessing the processes in the application container from the sidecar container.
- Sharing the /tmp directory between the sidecar and the application container.
- Storing the extracted data.
For this example, I will assume that you are running your application in Azure Kubernetes Service. However, most of the aspects of this solution will work on any Kubernetes installation.
Source Code
You can download the source code of the sample application and the Kubernetes manifests used in this article from the following GitHub repository.
Solution
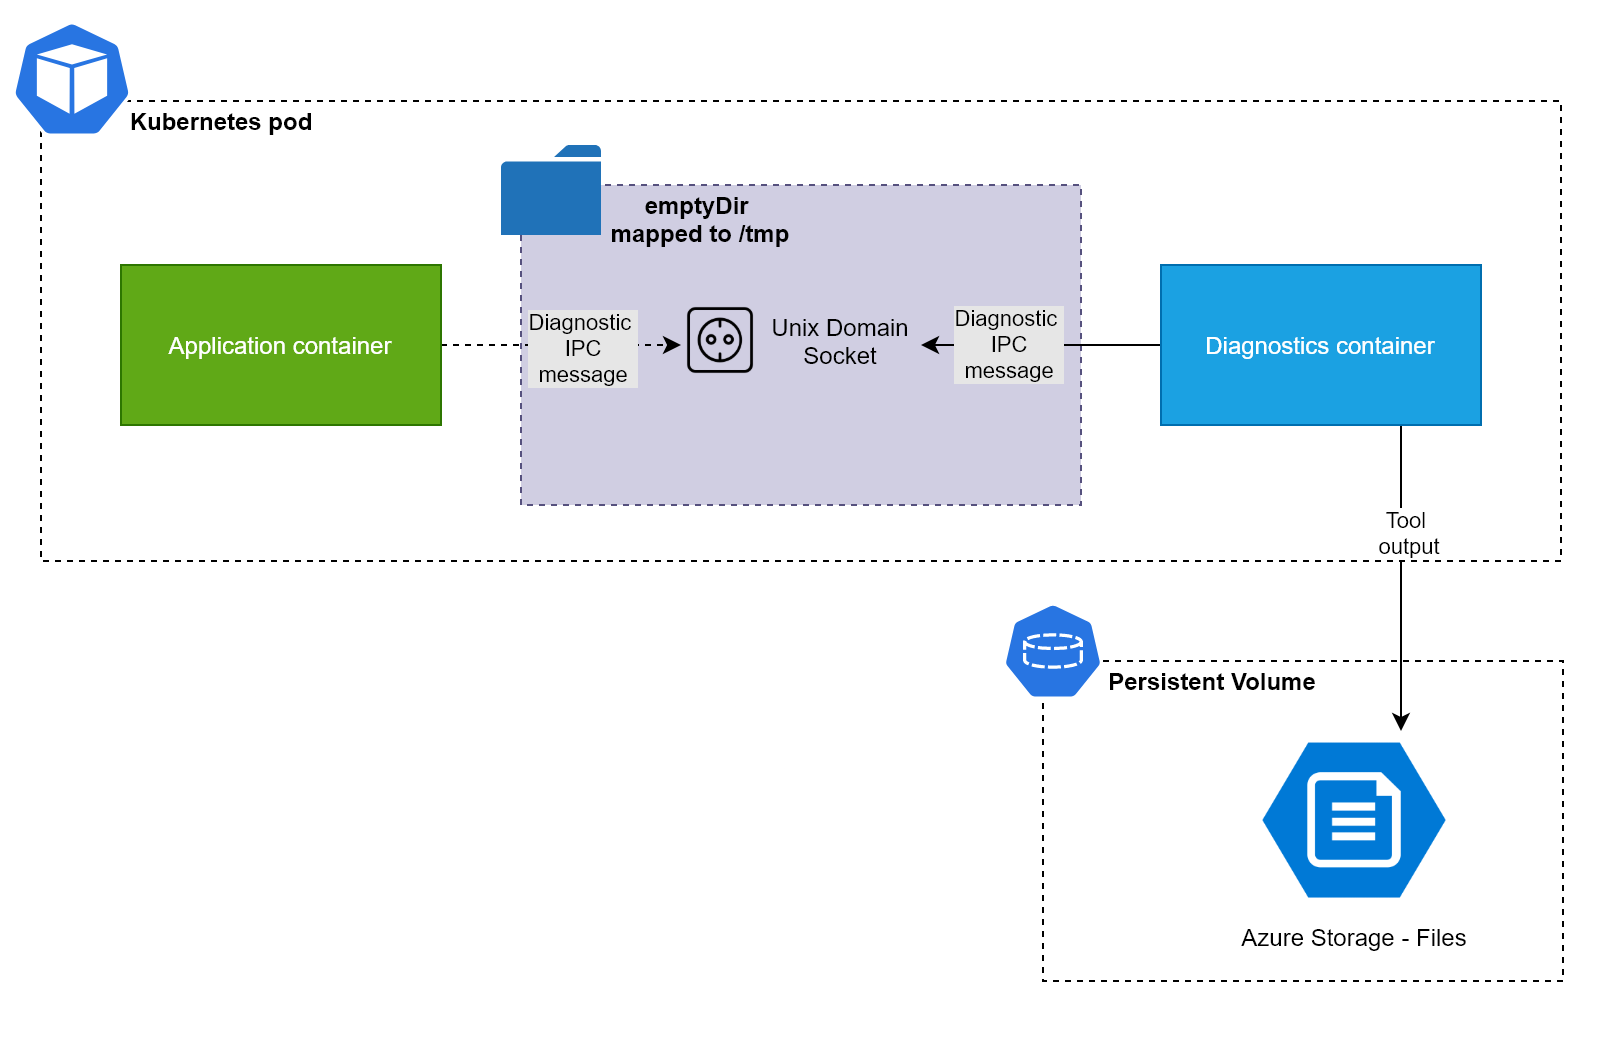
To address the problem, we will add a sidecar containing the diagnostics tools to our application container. We will map the /tmp directory on the two containers to an emptyDir volume. By default, emptyDir volumes are stored on the medium that backs the node, such as SSD. However, you can configure it to use the RAM as well. For fast access to the domain socket, use either the SSD or the RAM as the backing medium.
The output of the diagnostics tools is generally quite large. Also, we need to persist the output beyond the lifetime of the Pod and the Node. Therefore, we will mount Azure Files as a Persistent Volume to our sidecar to reliably persist the output of the diagnostics.
Following is the high-level design diagram of the components involved in the solution that we discussed:
Let’s build the individual components of the solution and integrate them.
Sample Application
Let’s create a simple worker service. An ASP.NET Core Worker Service is used to implement long-running background tasks. Create a folder for your project and execute the following command to create a new worker service.
dotnet new worker -lang C# -n HelloAKS
Open the newly created project in VS Code. To simulate a CPU intensive operation, we will program this service to find the prime number at a given position/index. For example, the prime number at position 0 is 1, at position 2 is 3, and so on.
Apply the following code in the Worker.cs file of the project. You can try to debug this program a few times to understand how it works.
public class Worker : BackgroundService
{
    private readonly ILogger<Worker> _logger;
    private int _primeNumberPosition = 0;

    public Worker(ILogger<Worker> logger)
    {
        _logger = logger;
    }

    protected override async Task ExecuteAsync(CancellationToken stoppingToken)
    {
        while (!stoppingToken.IsCancellationRequested)
        {
            _logger.LogInformation("Prime number at position {position} at {time} is {value}", _primeNumberPosition, DateTimeOffset.Now, FindPrimeNumber(_primeNumberPosition));
            _primeNumberPosition = (long)_primeNumberPosition + 100 > int.MaxValue ? 1 : _primeNumberPosition += 100;
        }

        _logger.LogInformation("Exiting worker at {time}", DateTimeOffset.Now);
    }

    public static long FindPrimeNumber(int n)
    {
        var count = 0;
        long a = 2;
        while (count < n)
        {
            long b = 2;
            var prime = 1;
            while (b * b <= a)
            {
                if (a % b == 0)
                {
                    prime = 0;
                    break;
                }

                b++;
            }

            if (prime > 0)
            {
                count++;
            }

            a++;
        }

        return --a;
    }
}
Let’s now create a container image for this application and publish the image to Docker Hub. You can also choose to push the container image to Azure Container Registry by following the steps outlined in the Microsoft quickstart guide. I have published the image of the application in my Docker Hub repository. If you wish to use the published image, then skip the following instructions.
If you haven’t already, install the VS Code Docker extension. Follow these instructions to use this utility to add a Dockerfile to your application. For your reference, here is the Dockerfile that the extension generated for the application.
FROM mcr.microsoft.com/dotnet/runtime:5.0 AS base
WORKDIR /app

FROM mcr.microsoft.com/dotnet/sdk:5.0 AS build
WORKDIR /src
COPY ["HelloAKS.csproj", "./"]
RUN dotnet restore "HelloAKS.csproj"
COPY . .
WORKDIR "/src/."
RUN dotnet build "HelloAKS.csproj" -c Release -o /app/build

FROM build AS publish
RUN dotnet publish "HelloAKS.csproj" -c Release -o /app/publish

FROM base AS final
WORKDIR /app
COPY --from=publish /app/publish .
ENTRYPOINT ["dotnet", "HelloAKS.dll"]
You can use either the extension or the following commands to build the image and push the image to the container registry. Remember to change the name of the repository before you build and push the image.
docker build --rm --pull -f "Dockerfile" -t "rahulrai/sidecar-monitor-app:latest" .
docker image push rahulrai/sidecar-monitor-app:latest
Let’s now build a container image for our diagnostics tools, which we will later deploy as sidecar to our application container.
Diagnostics Tools in a Container
Create a Dockerfile for the sidecar container and name it Dockerfile.tools. Populate the file with the following code, which instructs Docker to bundle the necessary tools inside an image.
FROM mcr.microsoft.com/dotnet/sdk:5.0 as tools
RUN dotnet tool install --tool-path /tools dotnet-trace
RUN dotnet tool install --tool-path /tools dotnet-dump
RUN dotnet tool install --tool-path /tools dotnet-counters

FROM mcr.microsoft.com/dotnet/runtime:5.0 AS runtime
COPY --from=tools /tools /tools

ENV PATH="/tools:${PATH}"
WORKDIR /tools
We will publish this image to Docker Hub (or Azure Container Registry) with the following commands. As before, remember to change the name of the repository in the following commands before you execute them. I have published the image generated from the Dockerfile on Docker Hub. Feel free to use either your image or mine in the next step.
docker build --rm --pull -f "Dockerfile.tools" -t "rahulrai/sidecar-monitor:latest" .
docker image push rahulrai/sidecar-monitor:latest
Let’s now start writing the specification to deploy the various components to Kubernetes.
Deploying to Kubernetes
I assume that you are running an AKS cluster, and your Kubernetes CLI (kubectl) context is configured to connect to your AKS cluster. Follow this quick start guide to create a cluster and configure kubectl if it is not the case.
The final component that we need is a persistent volume to store the output produced by the diagnostics tools. AKS allows you to dynamically create an Azure Files based persistent volume within the same resource group as your cluster nodes. Creating a dynamic persistent volume requires specifying a Storage Class (or Persistent Volume if the storage account already exists) and a Persistent Volume Claim.
Create a file named deployment.yaml and add the following specification to it, which, when applied dynamically creates a storage account and makes Azure Files share available as volume. We will soon mount this volume to our sidecar.
kind: StorageClass
apiVersion: storage.k8s.io/v1
metadata:
  name: monitor-azfiles
  namespace: net-worker
provisioner: kubernetes.io/azure-file
mountOptions:
  - dir_mode=0777
  - file_mode=0777
  - uid=0
  - gid=0
  - mfsymlinks
  - cache=strict
  - actimeo=30
parameters:
  skuName: Standard_LRS
---
apiVersion: v1
kind: PersistentVolumeClaim
metadata:
  name: monitor-azfiles
  namespace: net-worker
spec:
  accessModes:
    - ReadWriteMany
  storageClassName: monitor-azfiles
  resources:
    requests:
      storage: 5Gi
---
Let’s extend the manifest to specify a Deployment object. Please note the Pod specification in the Deployment, which defines that two containers, the application container, and the sidecar, will be created in each Pod.
apiVersion: apps/v1
kind: Deployment
metadata:
  namespace: net-worker
  labels:
    app: net-worker
  name: net-worker
spec:
  replicas: 1
  selector:
    matchLabels:
      app: net-worker
  template:
    metadata:
      labels:
        app: net-worker
    spec:
      shareProcessNamespace: true
      containers:
        - image: rahulrai/sidecar-monitor:latest
          imagePullPolicy: Always
          name: toolbox
          stdin: true
          tty: true
          volumeMounts:
            - name: tmp
              mountPath: /tmp
            - name: data
              mountPath: /data
        - image: rahulrai/sidecar-monitor-app:latest
          imagePullPolicy: Always
          name: app
          volumeMounts:
            - name: tmp
              mountPath: /tmp
      volumes:
        - name: tmp
          emptyDir: {}
        - name: data
          persistentVolumeClaim:
            claimName: monitor-azfiles
There are a few things worth noting in the previous specification as follows:
- We mounted a shared
emptyDirvolume at the path /tmp in both the containers. - We mounted the Azure Files share backed persistent volume at the path /data in the sidecar container.
- To make the processes discoverable between the two containers, we set the value of the setting
shareProcessNamespaceto true. You can read more about this feature on the Kubernetes documentation. - Note that the sidecar container doesn’t specify a command to run, and hence it will shut down soon after the start. To make the container interactive, we set two parameter values to true,
stdinto pass stdin to the container andttyto attach TTY to the process. TTY is used to enable I/O in interactive containers.
Let’s now apply the specification with the following command:
kubectl apply -f deployment.yaml
After applying the specification, you will find that a new storage account containing a file share service is created in your subscription. Let’s now test running a few diagnostics tools in our cluster.
Running dotnet-trace in Sidecar
Let’s now request shell to our sidecar container using the kubectl exec command as follows:
POD=$(kubectl get pods -n net-worker -o jsonpath="{.items[0].metadata.name}")
kubectl exec --stdin --tty $POD -n net-worker  -- /bin/bash
Tip: I recommend using k9s CLI to interact with your cluster. K9s has a simple UI, and it is very user friendly.
After executing the command, you will get a bash shell on the sidecar container. Let’s try to find out the process id of the application (running in the application container) with the following command:
dotnet-trace ps
The following screenshot from my cluster shows that the pid of my application is 13. I will run the dotnet-trace tool on the process next.

Execute the following command to gather trace from the application and store it in /data volume. Remember that the Azure file share service backs the data volume. We will instruct the tool to generate the traces in the Chromium format. You can read more about the other available formats in this interesting blog from Scott Hanselman.
dotnet-trace collect -p 13 --format Chromium -o /data/trace.json
The following screenshot presents the output of the command from my cluster.

Let’s download the generated file from the Azure portal as follows:
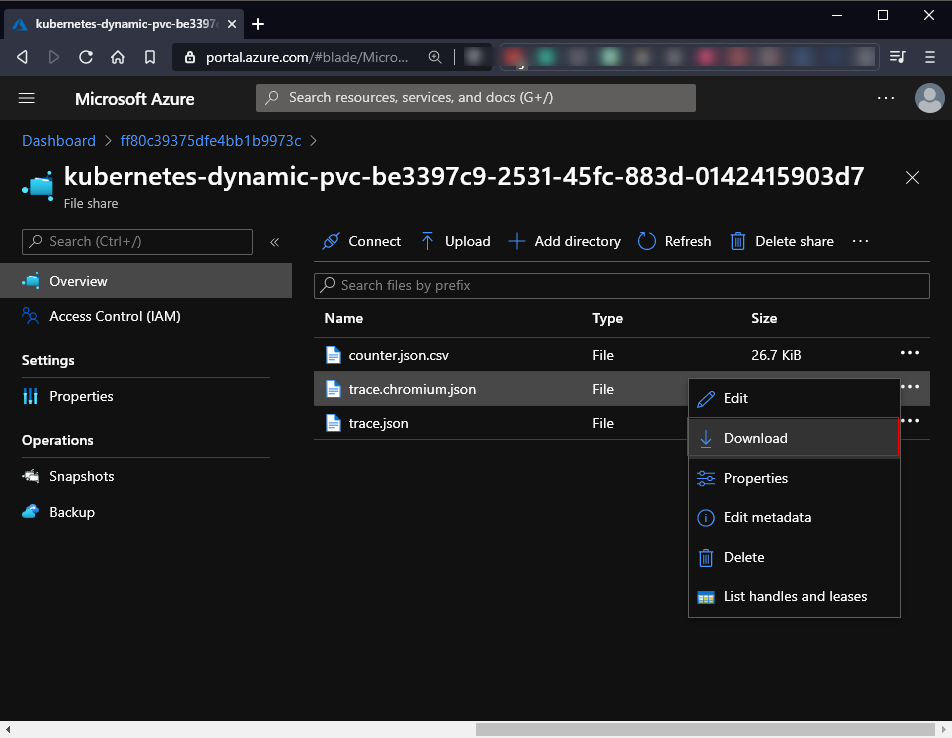
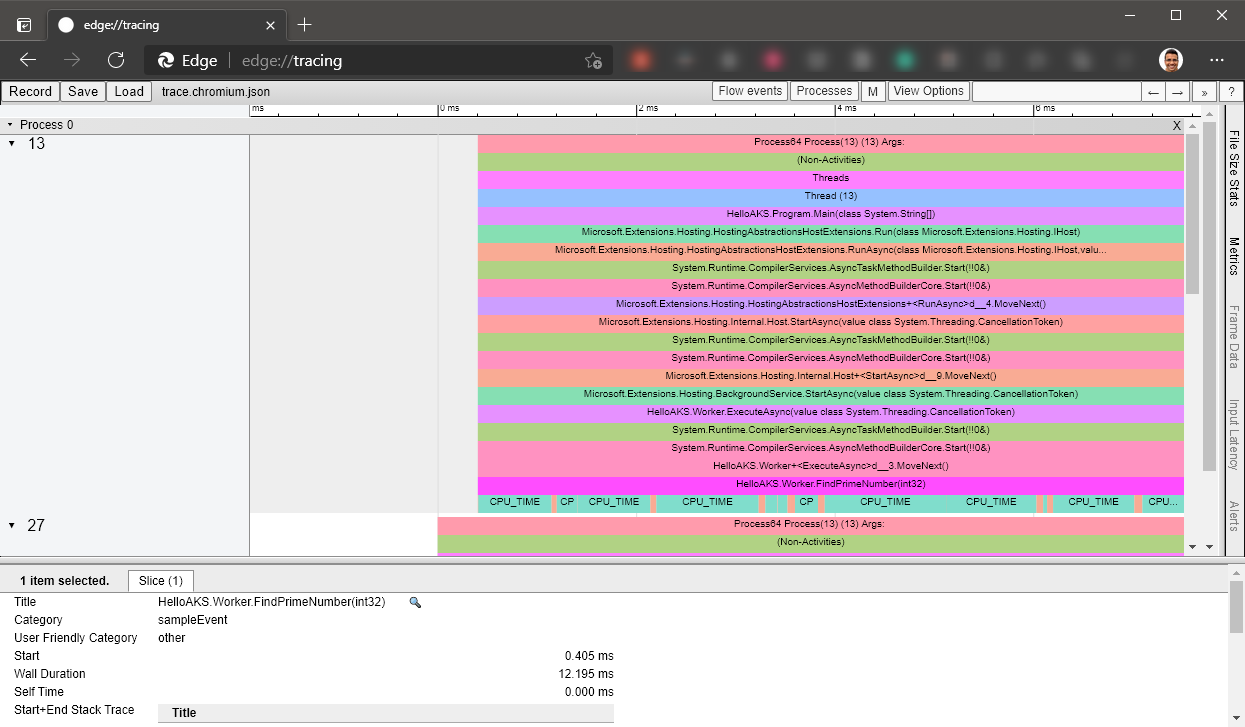
You can inspect the trace output file in any chrome based browser such as Edge by using the command edge://tracing/ in the new Edge or in the Chrome browser using the command chrome://tracing as follows:
Let’s try to collect some performance counter values using the dotnet-counters command.
Running dotnet-counters in Sidecar
Execute the following command after replacing the pid of the application.
dotnet-counters collect --process-id 256 --refresh-interval 10 --output /data/counters --format json
The following screenshot presents the output from my terminal.

As before, download the output file from Azure file share and open the file in VSCode. Following is the screenshot of the file I downloaded from the Azure file share.
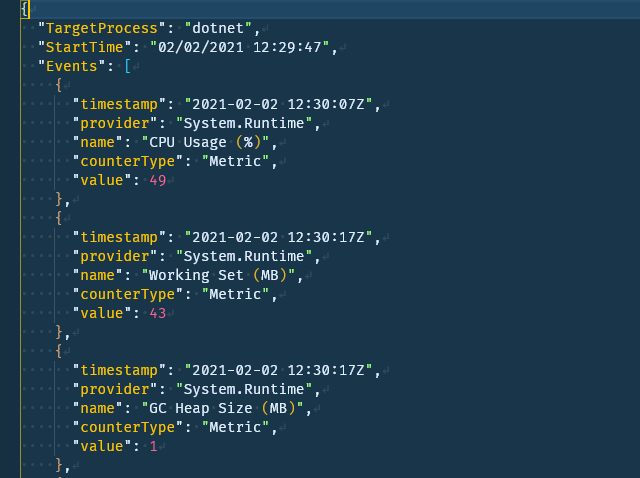
You can use the same approach to collect the output of other diagnostics tools by persisting them in an external volume. Feel free to try this approach to gather more diagnostics information about the application.
Conclusion
The cross-platform diagnostics tools are still evolving and getting better. You might see more tools or features added to existing tools to make them even better. I hope this post gave you some pointers on collecting diagnostics data from applications running in Kubernetes.
Did you enjoy reading this article? I can notify you the next time I publish on this blog... ✍