Development teams frequently need to build new microservices to either add new functionality or replace existing microservices. However, microservices must support some standard features such as providing insight into their health through logging, allowing monitoring, and following the organization’s security standards. A reusable microservices platform can help developers jumpstart the development process by providing reusable components that they can use to build new microservices.
To implement a reusable microservices platform, you can use the sidecar pattern or build NuGet packages that are installed in every microservice. Monitoring, tracing, and logging are the key components that must exist in your platform. We will cover an implementation of the platform consisting of the three components in this article. However, you may build many more platform components to implement standard technical policies such as handling database connections, retries, timeouts, etc.
At this point, a question that you might be thinking about is how much should you include in your platform? Although there is no standard answer to the question, consider the following points when you need to decide whether to add a feature to the platform:
- What is the impact on the services that are not running the same version of the platform?
- If the platform needs to be synchronized across the services and often changes, it can become a development bottleneck.
- Are the majority of services going to use the feature?
Try to hit the sweet spot between implementing cross-cutting concerns and the ability to roll out platform changes incrementally. Such platform implementation will ensure that the developers can focus on the business logic and not worry about the cross-cutting concerns, and you can evolve the platform without disrupting the development teams.
Platform Components
Now that we understand that there is more to creating a new microservice than just creating a new, empty ASP.NET Core project, we will build the following three components that will be available to every microservice across our organization:
- Structured logging
- Health check
- Tracing
Our goal is to standardize the cross-cutting features and enable the developers to use the platform components with minimal effort. A new microservice will only have to install the custom NuGet package Microservice.Platform and a little startup code to use the platform. As I said before, don’t feel bound by the scope of this implementation, and identify the areas that you want to standardize across your microservices. For example, you might want to standardize how personal information is redacted from the logs, how output caching is handled, how database connections are handled, and so on.
Source Code
Following is the source code of the microservices platform for your reference:
We will discuss the implementation of the platform components in the next section.
Component 1: Structured Logging
We will use Serilog to implement the logging component. Serilog is a structured logging library for .NET. Serilog enrichers are used for enriching the log events with additional information. Enrichers can be specified using the Enrich.With fluent API of the Serilog LoggerConfiguration. We will use the following enrichers in our implementation:
- Log context enricher: This enricher is used to add and remove properties from the ambient log context dynamically.
- Span enricher: This enricher adds the span unique identifier, parent span unique identifier, ASP.NET trace identifier to the log event.
Create a .NET Core class library named Microservices.Platform and add the NuGet packages Microsoft.Extensions.Hosting, Serilog.AspNetCore, and Serilog.Enrichers.Span to it. Add a class named HostBuilderExtensions to the project and add the following code to it:
public static IHostBuilder UseLogging(this IHostBuilder builder)
{
    return builder.UseSerilog((context, logger) =>
    {
        logger
            .Enrich.FromLogContext()
            .Enrich.WithSpan();

        if (context.HostingEnvironment.IsDevelopment())
        {
            logger.WriteTo.Console(
                outputTemplate:
                "{Timestamp:yyyy-MM-dd HH:mm:ss} {TraceId} {Level:u3} {Message}{NewLine}{Exception}");
        }
        else
        {
            logger.WriteTo.Console(new JsonFormatter());
        }
    });
}
The code listing abstracts the logging configuration from the microservices and makes it available through a convenient extension method called UseLogging. We can call this method from the Program class of each microservice like so:
CreateHostBuilder(args).Build().Run();

static IHostBuilder CreateHostBuilder(string[] args) =>
  Host.CreateDefaultBuilder(args)
    .UseLogging()
    .ConfigureWebHostDefaults(
        webBuilder => { webBuilder.UseStartup<Startup>(); });
Launch the test microservice application and generate logs from it. You can observe the structured logs in the output console as follows:

To create a package of this library, use the dotnet pack command as follows:
dotnet pack -c release
The command creates a NuGet package named Microservices.Platform in the bin/Release directory. Since our package depends on other NuGet packages, the dependencies will be automatically installed whenever it is installed in a project. To distribute the package internally, you can use Azure Artifacts that provides public and private NuGet feeds as a service.
Component 2: Health Check
We will use the ASP.NET Core’s health checks feature to implement two monitoring endpoints as follows:
/health/liveresponds to every request with an HTTP 200 OK status code to indicate that the service is healthy and can handle requests./health/startupperforms a basic health check and responds with HTTP 200 OK if the health check succeeds. If the health check fails, the service will respond with HTTP 503 Service Unavailable.
There are two parts to adding a health check in an ASP.NET Core application. First, add the health check to the service collection, and next, configure the health check in the application builder. Let’s begin with adding a class named ServiceCollectionExtensions to the platform project. Populate the class with the following code that performs a basic health check and two utility methods for adding more health checks:
public static class ServiceCollectionExtensions
{
    private const string Liveness = "liveness";
    private const string Startup = "startup";

    public static IServiceCollection AddBasicHealthChecks(
        this IServiceCollection services)
    {
        services.AddHealthChecks()
            .AddCheck("BasicStartupHealthCheck",
                () => HealthCheckResult.Healthy(), new[] {Startup})
            .AddCheck("BasicLivenessHealthCheck",
                () => HealthCheckResult.Healthy(), new[] {Liveness});

        return services;
    }

    public static IServiceCollection AddAdditionStartupHealthChecks<T>(
        this IServiceCollection services) where T : class, IHealthCheck
    {
        services.AddHealthChecks().AddCheck<T>(nameof(T), tags: new[]
        {
            Startup
        });
        return services;
    }

    public static IServiceCollection AddAdditionLivenessHealthChecks<T>(
        this IServiceCollection services) where T : class, IHealthCheck
    {
        services.AddHealthChecks().AddCheck<T>(nameof(T), tags: new[]
        {
            Liveness
        });
        return services;
    }
}
The next step is to add the health check to the application builder. Create a class named ApplicationBuilderExtension and add the following code to it:
public static class ApplicationBuilderExtensions
{
    public static IApplicationBuilder UseKubernetesHealthChecks(this IApplicationBuilder app)
    {
        return
            app
                .UseHealthChecks("/health/startup",
                    new HealthCheckOptions {Predicate = x => x.Tags.Contains("startup")})
                .UseHealthChecks("/health/live",
                    new HealthCheckOptions {Predicate = x => x.Tags.Contains("liveness")});
    }
}
The tags “startup” and “liveness” are used to identify the endpoint that a check belongs to. In addition, the tags ensure that additional health checks are added to the correct family of checks that are executed on the invocation of the startup and liveness endpoints.
Following is an implementation of a dummy health check to demonstrate how a microservice can extend the health check functionality:
public class DummyStartupCheck : IHealthCheck
{
    public Task<HealthCheckResult> CheckHealthAsync(HealthCheckContext context,
        CancellationToken cancellationToken = new()) => Task.FromResult(new HealthCheckResult(HealthStatus.Healthy));
}
You can add this health check to the service collection of the microservice as follows:
public void ConfigureServices(IServiceCollection services)
{
    // Other service registrations
    services.AddBasicHealthChecks()
        .AddAdditionStartupHealthChecks<DummyStartupCheck>();
}
Finally, we will leverage the application builder extension that we built earlier to enable the DummyStartupCheck on the standard monitoring endpoint of the microservice as follows:
public void Configure(IApplicationBuilder app, IWebHostEnvironment env)
{
    app.UseRouting();
    app.UseEndpoints(endpoints => { endpoints.MapControllers(); });
    app.UseKubernetesHealthChecks();
}
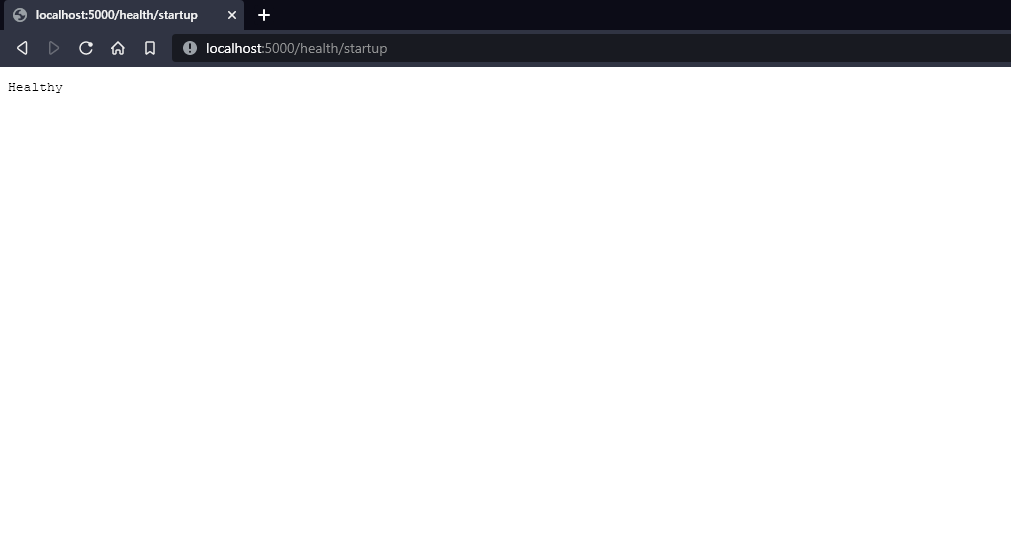
Let’s launch the microservice application and verify the response from the health endpoint as follows:

Component 3: Tracing
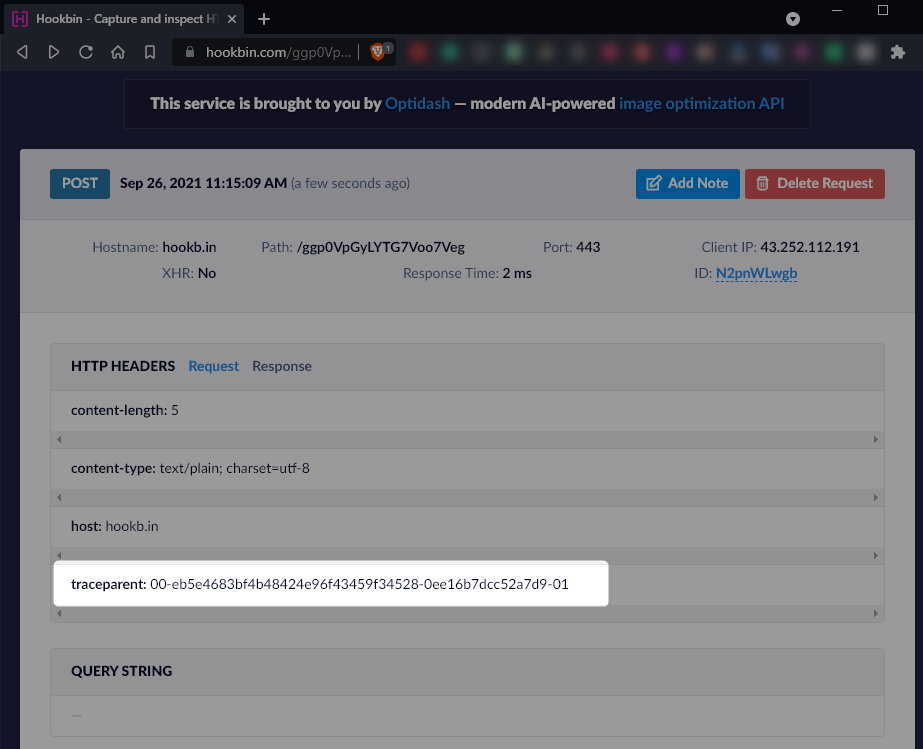
The third component that you should standardize across microservices is application tracing. Distributed tracing allows you to trace the execution of a request across multiple services. Request correlation happens via the traceparent header as specified in the W3C Trace Context standard. Following is the format of the W3C compatible traceparent header:
traceparent: <version>-<trace-id>-<span-id>-<trace flags>
The trace id is generated by the first service that receives the request. Each service generates a new span id for each request, and so the span id in the header will change as the request moves through the system.
ASP.NET Core implements the trace context standard out of the box, so it will look for traceparent headers in incoming requests and propagate the trace id to the outgoing requests made with HTTPClient. If there is no traceparent header in the incoming request, ASP.NET Core will generate a new trace id and span id and add the trace context header to the outgoing request.
In .NET Core, distributed tracing instrumentation is added to an application through the System.Diagnostics.ActivitySource and System.Diagnostics.Activity classes. HTTP requests in ASP.NET have an associated activity (Activity) that is created when the request is received and destroyed when the request is completed. The activity is propagated to the outgoing requests made with HTTPClient. You can use the Activity class to create a span from the ActivitySource and record span information such as events, tags, and baggage. To understand the steps involved in instrumenting distributed tracing in your application, I recommend reading the detailed step-by-step guide on the Microsoft documentation website.
To standardize distributed tracing instrumentation across microservices, add a new method named AddOtelServices to the HostBuilderExtensions class as follows:
public static IServiceCollection AddOtelServices(this IServiceCollection services, string applicationName)
{
    Activity.DefaultIdFormat = ActivityIdFormat.W3C;

    services.AddOpenTelemetryTracing(builder => builder
        .AddAspNetCoreInstrumentation()
        .SetResourceBuilder(ResourceBuilder.CreateDefault().AddService(applicationName))
        .AddHttpClientInstrumentation(options => options.SetHttpFlavor = true)
        .SetSampler(new AlwaysOnSampler())
        .AddConsoleExporter(options => options.Targets = ConsoleExporterOutputTargets.Console));

    return services;
}
Let’s discuss the implementation in a little more detail. The method AddAspNetCoreInstrumentation adds OpenTelemetry instrumentation to the .NET Core application. The SetResourceBuilder method allows you to add common attributes to all spans in the application. We used this method to add the name of the application to all the spans. The AddHttpClientInstrumentation method enables you to instrument System.Net.Http.HttpClient and System.Net.HttpWebRequest to collect telemetry about outgoing HTTP requests. You can read more about the HttpClient and HttpWebRequest instrumentation for OpenTelemetry in the GitHub docs. The SetSampler method allows you to adjust the number of samples of traces collected and sent to the OpenTelemetry collector. The AddConsoleExporter method exports the collected telemetry to the console. In production, you should use other useful exporters such as Jaeger, Zipkin, or Prometheus.
To enable distributed tracing in your application, add the following to the ConfigureServices method of the microservice:
public void ConfigureServices(IServiceCollection services)
{
    services.AddOtelServices(Env.ApplicationName);
}
We will now test the implementation by inspecting the trace generated from an HTTP request sent from the test application. First, define an endpoint in the test application that adds an event to the span and sends an HTTP POST request to the Hookbin service.
[HttpPost]
public async Task<HttpResponseMessage> Post()
{
    Activity.Current?.AddEvent(new ActivityEvent("Sending request to HookBin"));
    return await _client.PostAsync("https://hookb.in/ggp0VpGyLYTG7Voo7Veg", new StringContent("Hello"));
}
The following screenshot presents the W3C compatible traceparent header generated by ASP.NET Core and received by the Hookbin service:

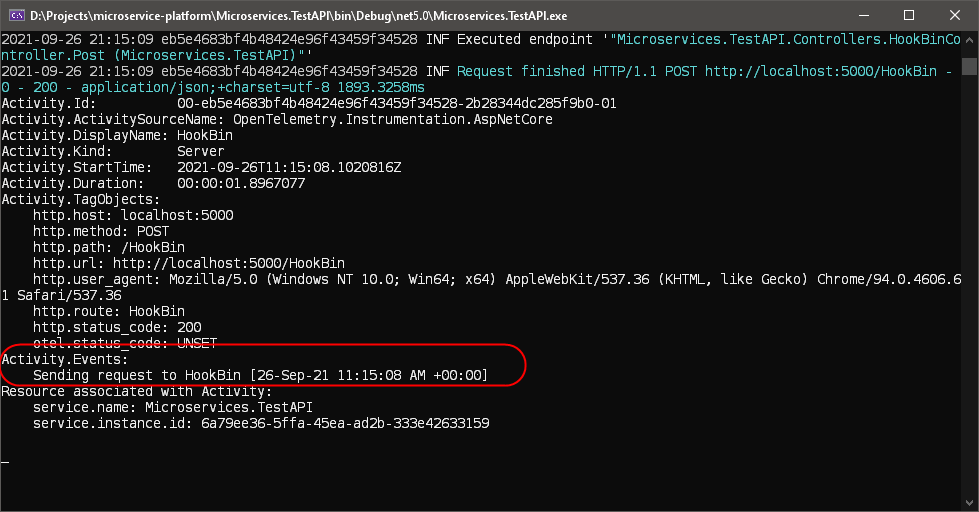
The following screenshot presents the trace generated by the test application, which is subsequently sent to the console. In the trace, note the event that we added to the span just before sending the request to the Hookbin service:

Conclusion
To increase the velocity of your microservice development, you should develop a standard platform that standardizes common microservices behavior such as logging, monitoring, and other cross-cutting concerns. Remember, it is easy to have the platform grow in size and complexity. Therefore, you should strictly only address cross-cutting technical concerns in the platform and not the domain logic of any microservice.
NuGet is a suitable format for distributing a microservice platform, and you can use Azure Artifacts to publish private NuGet feeds that only the developers of your organization can access.
Did you enjoy reading this article? I can notify you the next time I publish on this blog... ✍