In this series:
- Distributed Tracing with Jaeger (this article)
- Simplifying the setup with Tye
Modern microservices applications consist of many services deployed on various hosts such as Kubernetes, AWS ECS, and Azure App Services or serverless compute services such as AWS Lambda and Azure Functions. One of the key challenges of microservices is the reduced visibility of requests that span multiple services. In distributed systems that perform various operations such as database queries, publish and consume messages, and trigger jobs, how would you quickly find issues and monitor the behavior of services? The answer to the perplexing problem is Distributed Tracing.
Distributed Tracing, Open Tracing, and Jaeger
Distributed Tracing is the capability of a tracing solution that you can use to track a request across multiple services. The tracing solutions use one or more correlation IDs to collate the request traces and store the traces, which are structured log events across different services, in a central database.
Open Tracing defines an open, vendor-neutral API for distributed tracing. The specification allows the vendors such as Jaeger and Zipkin to implement their unique distributed tracing functionality and enables the users to avoid vendor lock-in from a particular tracer implementation.
Jaeger is an open-source tracing system for microservices, and it supports the Open Tracing standard. It was initially built and open-sourced by Uber Technologies and is now a CNCF graduated project. Some of the high-level use cases of Jaeger are the following:
- Performance and latency optimization
- Distributed transaction monitoring
- Service dependency analysis
- Distributed context propagation
- Root cause analysis
Jaeger is composed of multiple components as follows:
- Client libraries: These are language-specific implementations of the Open Tracing API.
- Agent: The agent is a network daemon that collects spans from the application, batches them, and sends them to the collector.
- Collector: The collector receives traces from the agent and runs them through a processing pipeline which validates the traces, indexes them, performs any transformations, and finally stores them.
- Query: The query service retrieves traces from storage and renders the UI to display them.
You can run Jaeger on your local environment (and CI/CD environments) using the Jaeger all-in-one container image that runs all the components of Jaeger in one container. In the production environment, you should run each component independently. The deployment guide on the Jaeger website covers guidance and recommendations on the models of deployment.
Jaeger All-in-One
Execute the following command to spin up a Jaeger container backed by an in-memory storage component called Badger.
docker run -d \
  -p 6831:6831/udp \
  -p 6832:6832/udp \
  -p 14268:14268 \
  -p 14250:14250 \
  -p 16686:16686 \
  -p 5778:5778  \
  --name jaeger jaegertracing/all-in-one:1.22
Once the container is running, you can inspect the Jaeger dashboard by navigating to http://localhost:16686/.
Source Code
You can download the source code of the demo application from my GitHub repository.
Demo Application: DCalculator
To mimic a microservices application, we will create two interdependent ASP.NET Core Web APIs so that every request traverses the APIs, thus producing distributed traces.
DCalculator is a distributed calculator application composed of several microservices, each of which performs a unique mathematical operation. To keep the demo concise, we will create a microservice named Calculator that accepts the parameters required for computing the log of a number for a given log base. We will also create another service named LogService that receives the request to calculate log value from the Calculator service and uses the following formula to calculate the log of a number- N for a given base- x.
Logₓ(N) = Logₐ(N)/Logₐ(x)
Launch your terminal and create a WebAPI project named Calculator using the following command:
dotnet new webapi -n Calculator -o calculator
In your terminal, change to the calculator directory and install the following packages:
dotnet add package Jaeger
dotnet add package OpenTracing.Contrib.NetCore
Edit the ConfigureServices method in the Startup class as follows to log traces to our default localhost installation of Jaeger. For details on the library usage, please refer to the Jaeger C# Client library documentation.
public void ConfigureServices(IServiceCollection services)
{
    ...
    services.AddOpenTracing();
    // Adds the Jaeger Tracer.
    services.AddSingleton<ITracer>(sp =>
    {
        var serviceName = sp.GetRequiredService<IWebHostEnvironment>().ApplicationName;
        var loggerFactory = sp.GetRequiredService<ILoggerFactory>();
        var reporter = new RemoteReporter.Builder().WithLoggerFactory(loggerFactory).WithSender(new UdpSender())
            .Build();
        var tracer = new Tracer.Builder(serviceName)
            // The constant sampler reports every span.
            .WithSampler(new ConstSampler(true))
            // LoggingReporter prints every reported span to the logging framework.
            .WithReporter(reporter)
            .Build();
        return tracer;
    });

    services.Configure<HttpHandlerDiagnosticOptions>(options =>
        options.OperationNameResolver =
            request => $"{request.Method.Method}: {request?.RequestUri?.AbsoluteUri}");
}
We registered the Open Tracing interface ITracer in our dependency injection that resolves to an instance of the Jaeger Tracer. We will later use the ITracer interface to create spans. A span is a unit of work or time in your application. A span can be nested inside another span, and it can contain tags and logs.
You may use the options pattern in ASP.NET Core to configure HttpHandlerDiagnosticOptions, which is used to customize the span properties. We configured it to customize the operation name to display the HTTP verb and the absolute URL of the request. You can use it also to customize other features such as ignoring specific requests, adding tags to spans, and modifying the spans created when an error occurs.
An Open Telemetry Trace is a Directed Acyclic Graph (DAG) of Spans. A vertex connecting two spans is called a Reference.
Let’s add a controller named CalculatorController to our application and set it up to send a request to the Log service. We will also add a custom span to our controller to record our operation as follows:
public class CalculatorController : ControllerBase
{
    private readonly IHttpClientFactory _clientFactory;
    private readonly ITracer _tracer;

    public CalculatorController(IHttpClientFactory clientFactory, ITracer tracer)
    {
        _clientFactory = clientFactory;
        _tracer = tracer;
    }

    [HttpGet("log")]
    public async Task<ActionResult> ComputeLog(int n, int x)
    {
        var actionName = ControllerContext.ActionDescriptor.DisplayName;
        using var scope = _tracer.BuildSpan(actionName).StartActive(true);
        var client = _clientFactory.CreateClient("logService");
        var response = await client.GetAsync($"/log/compute?n={n}&x={x}");
        return response.IsSuccessStatusCode
            ? Ok(Convert.ToDouble(await response.Content.ReadAsStringAsync()))
            : Problem("Log service failed");
    }
}
Our Calculator service is now ready. Create the Log service WebAPI application and edit the Startup class to add the Open Tracing instrumentation and set up the Jaeger tracer just as you did previously.
To demonstrate how you can record logs with the spans, let’s create a controller named LogController and add an endpoint named Compute to it. The Compute endpoint will compute the log of the number for the given base and return the result in the response. We will record this operation in a custom span and also add a log to the span as follows:
public class LogController : ControllerBase
{
    private readonly ITracer _tracer;

    public LogController(ITracer tracer)
    {
        _tracer = tracer;
    }

    [HttpGet("compute")]
    public ActionResult<double> Compute(int n, int x)
    {
        var actionName = ControllerContext.ActionDescriptor.DisplayName;
        using var scope = _tracer.BuildSpan(actionName).StartActive(true);
        scope.Span.Log($"Requested log compute of #{n}, base {x}");
        return Ok(Math.Log(n) / Math.Log(x));
    }
}
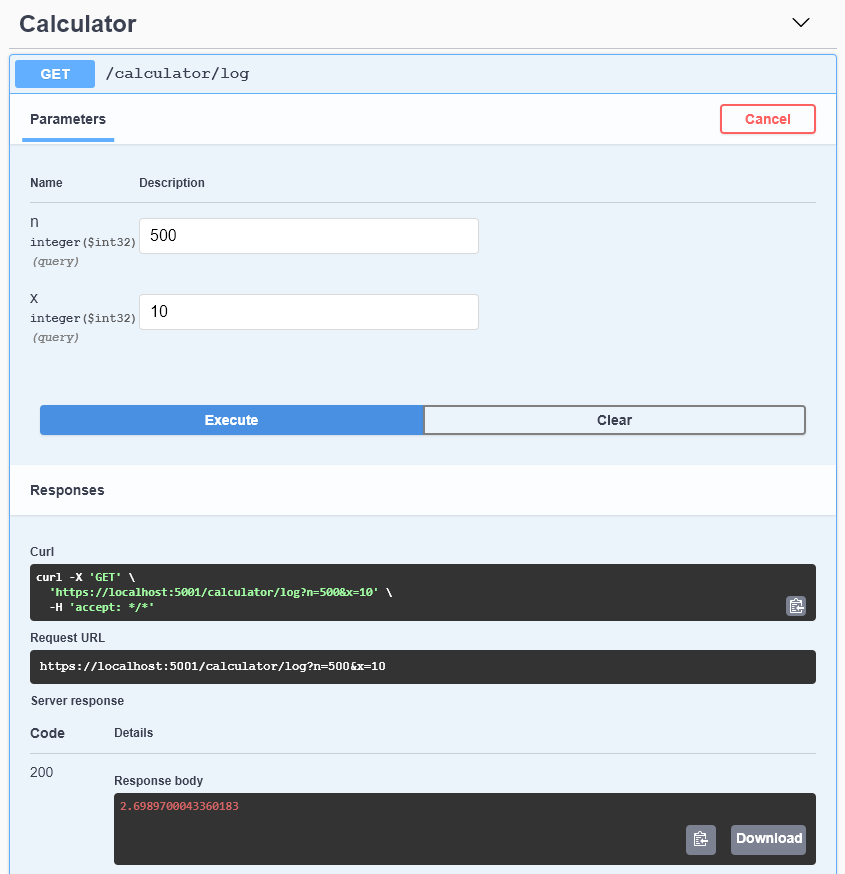
Let’s launch both the services and invoke the Calculator service’s Log endpoint a few times to generate a few traces.

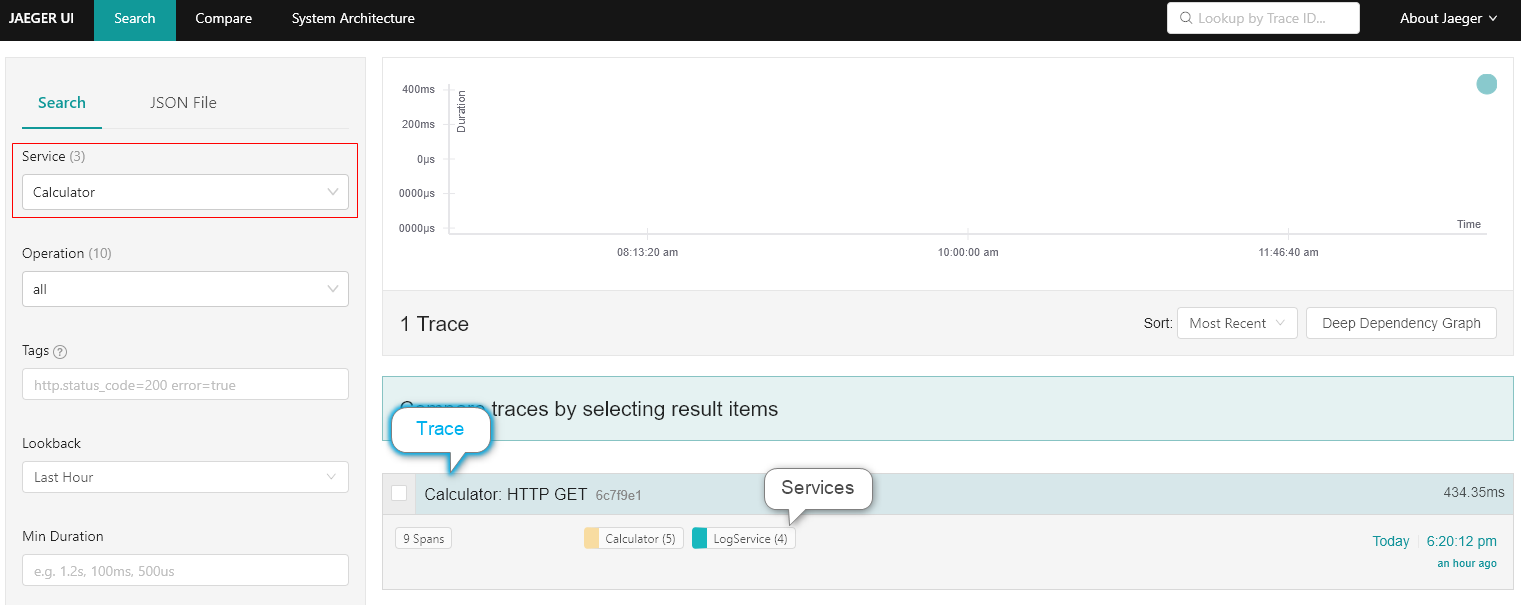
Please navigate to the Jaeger UI at http://localhost:16686 to view the traces that we created. In the Find Traces panel, click on the dropdown, select the Calculator service from the list, and click on the Find Traces button.

The trace view presents some helpful information about the request, such as:
- The duration of the request.
- The name of services and the spans recorded by the services in the trace.
- The time of the request.
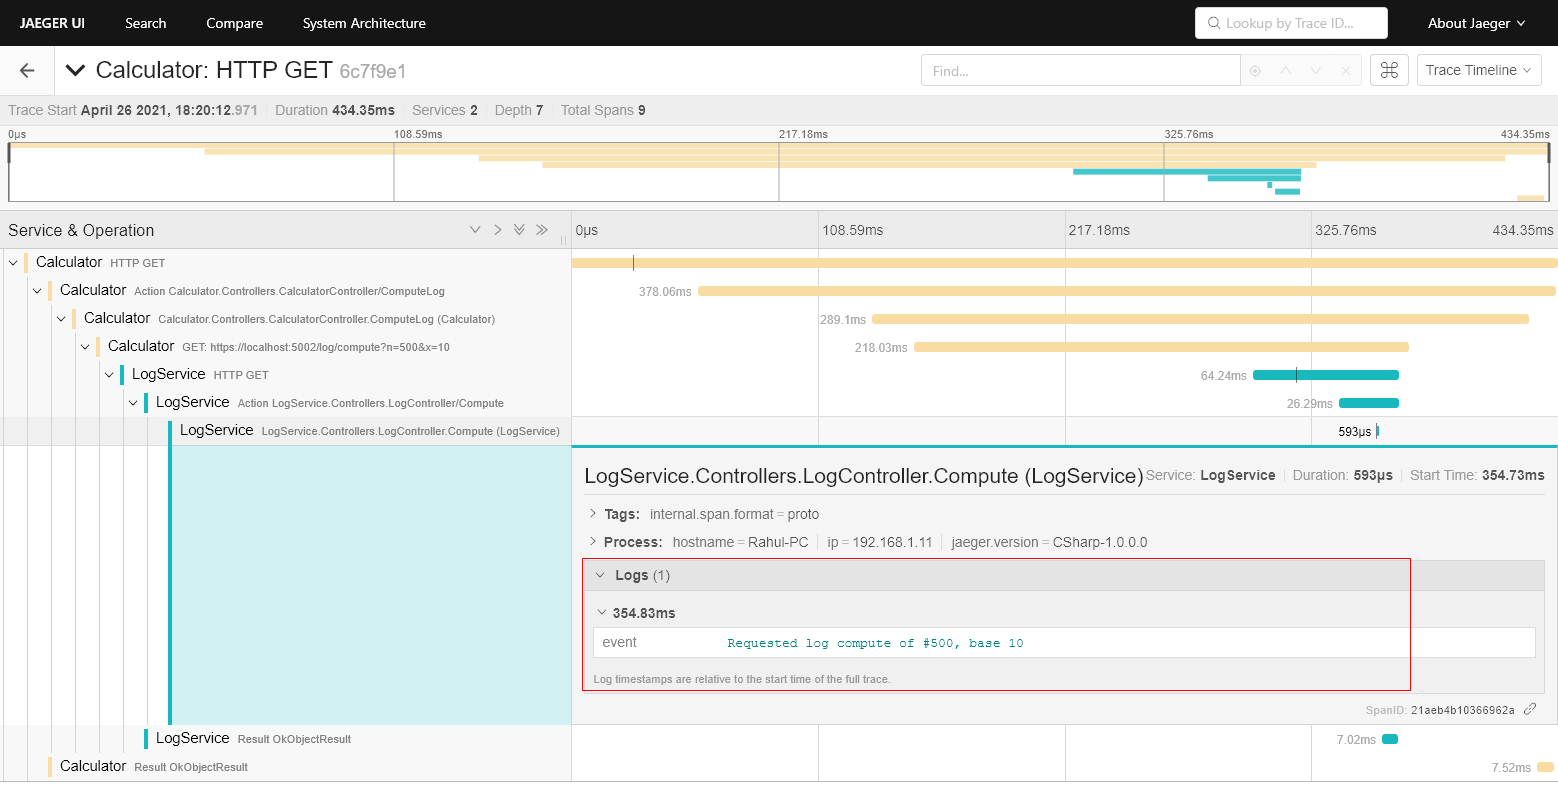
Click on a trace to view the spans present in it.

In the expanded trace view, you can inspect each span in detail. You can use this view to identify the latency added by the dependencies to a request and optimize your application. You can also view the details of a span by clicking on it. Let’s inspect the log statement that the Log service added to the span.

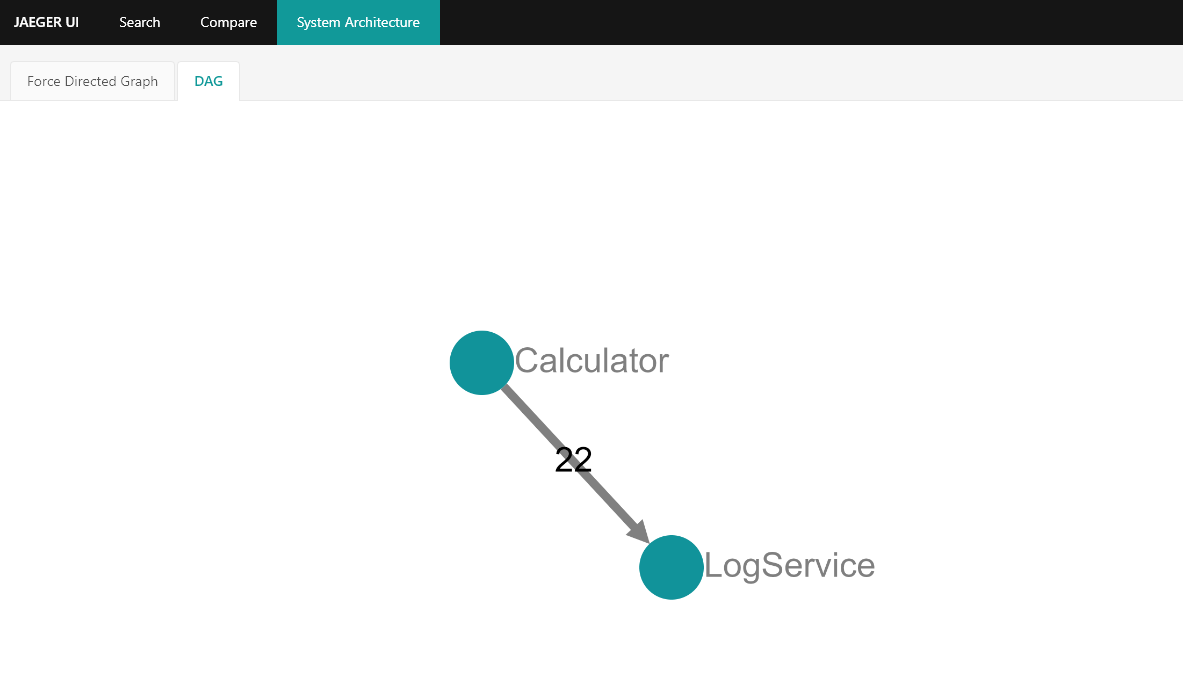
You can view the service dependencies in the Dependencies tab. For example, the following view shows that the Calculator service is dependent on the Log service:

Summary
In this short article, we discussed the benefits of distributed tracing. We learned to set up Jaeger in the local environment and its integration with ASP.NET Core applications.
In the following article in this series, we will use this application to learn Microsoft Tye. Tye is an experimental developer tool from Microsoft that makes building, testing, and deploying microservices easier. Let’s find out how it affects our application development and deployment process.
Did you enjoy reading this article? I can notify you the next time I publish on this blog... ✍