You might have previously used observability tools such as Prometheus, Azure Monitor, AWS Container Insight, or commercial products such as Logic Monitor to monitor your Kubernetes cluster. Let’s probe the Kubernetes magic that makes the beautiful CPU and memory dials tick on the monitoring dashboards.
Kubernetes has a built-in Metrics API (see spec.) and a simple CLI query, kubectl top (documentation), that you can use to fetch a snapshot of the CPU and memory consumption of a Kubernetes object. The Kubernetes Metrics API is dependent on the Metrics Server cluster add-on that gathers resource usage from the Kubelets of the cluster. The primary consumer of the Metrics API is the Horizontal Pod Autoscaler. The Horizontal Pod Autoscaler (HPA) uses the metrics served by the Metrics API to scale the number of pods based on the observed resource metrics values. Apart from the Metrics API, HPA is designed to also consume metrics from your application running on the cluster (custom metrics) and services outside the cluster (external metrics) to autoscale pods. Some examples of external metrics provider to HPA are the popular open-source events-based autoscaling service KEDA and soon Logic Monitor. Similar to HPA, Vertical Pod Autoscaler (VPA) relies on Metrics Server as well. VPA allows you to automatically scale the CPU and memory constraints of the containers in a pod.
We now understand that autoscaling and monitoring are the two primary use cases of the Metrics API and the Metrics Server. To explore Kubernetes monitoring in-depth, you must have a Metrics Server deployed on your cluster. If you are running an AWS EKS cluster, use the instructions in the EKS Metrics Server Guide to install the Kubernetes Metrics Server on your cluster. It is easy to install the Metrics Server on a cluster. Execute the following command from your terminal, and you will have one ready in no time:
kubectl apply -f https://github.com/kubernetes-sigs/metrics-server/releases/latest/download/components.yaml
Azure AKS clusters include a Metrics Server deployment by default. To create a barebone AKS cluster, execute the following AZ CLI commands from your terminal:
az group create --name <resource group name> --location australiaeast
az aks create -n <cluster name> --node-count 1 --node-vm-size Standard_B2s --load-balancer-sku basic --node-osdisk-size 32 --resource-group <resource group name> --generate-ssh-keys
az aks get-credentials --resource-group <resource group name> --name <cluster name>
To verify the health of the Metrics Server deployment, execute the following command:
kubectl get deployment metrics-server -n kube-system
We need an application running on our cluster to test the features of the Metrics API implemented by the Metrics Server. To that end, let’s deploy the Azure Voting App to our cluster, a simple application that consists of a Redis backend and a Python frontend, each of which runs on one pod. Execute the following command from your terminal to deploy the application to your cluster:
kubectl apply -f https://raw.githubusercontent.com/Azure-Samples/azure-voting-app-redis/master/azure-vote-all-in-one-redis.yaml
To get the external IP address of the front end of the application, execute the following command. Note that it might take some time for the cloud to allocate an external IP address to your service:
kubectl describe services azure-vote-front | grep 'LoadBalancer Ingress'
You should now have a fully functional application running on your cluster. Navigate to the front end of the application from your browser at the IP address you received from the previous command’s output.
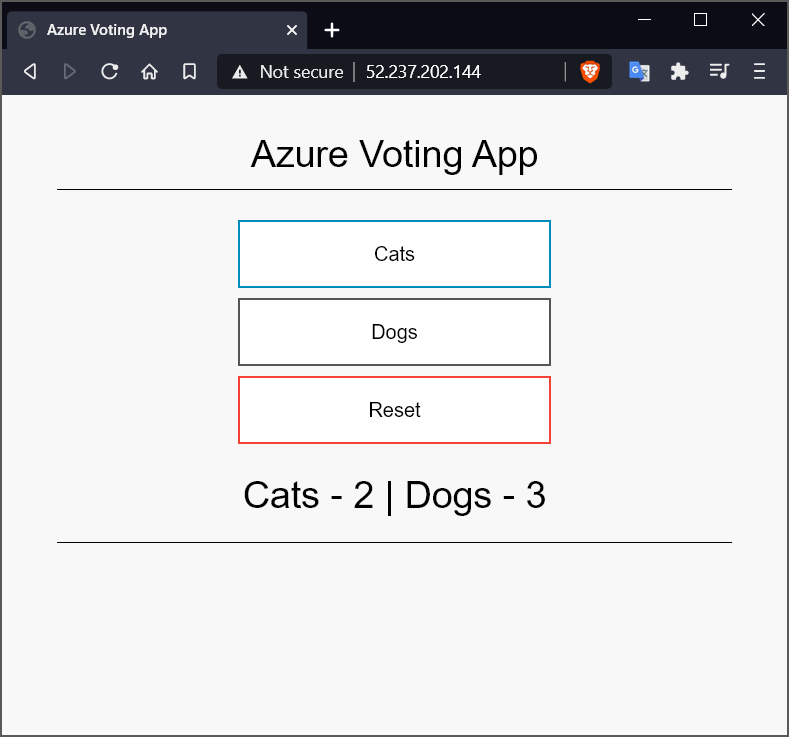
Let’s start monitoring the various objects in our cluster next.
Monitoring Nodes
The endpoint of the Metrics API is: /apis/metrics.k8s.io/. To access this API, you can either:
- Use port forwarding with the following command:
kubectl port-forward -n kube-system svc/metrics-server :443
- Use
kubectlas follows:
kubectl get --raw "/apis/metrics.k8s.io/v1beta1/<api endpoint>" | jq '.'
Let’s inspect the resources that are available to query with the API by sending a GET request to the /apis/metrics.k8s.io/v1beta1/ endpoint:
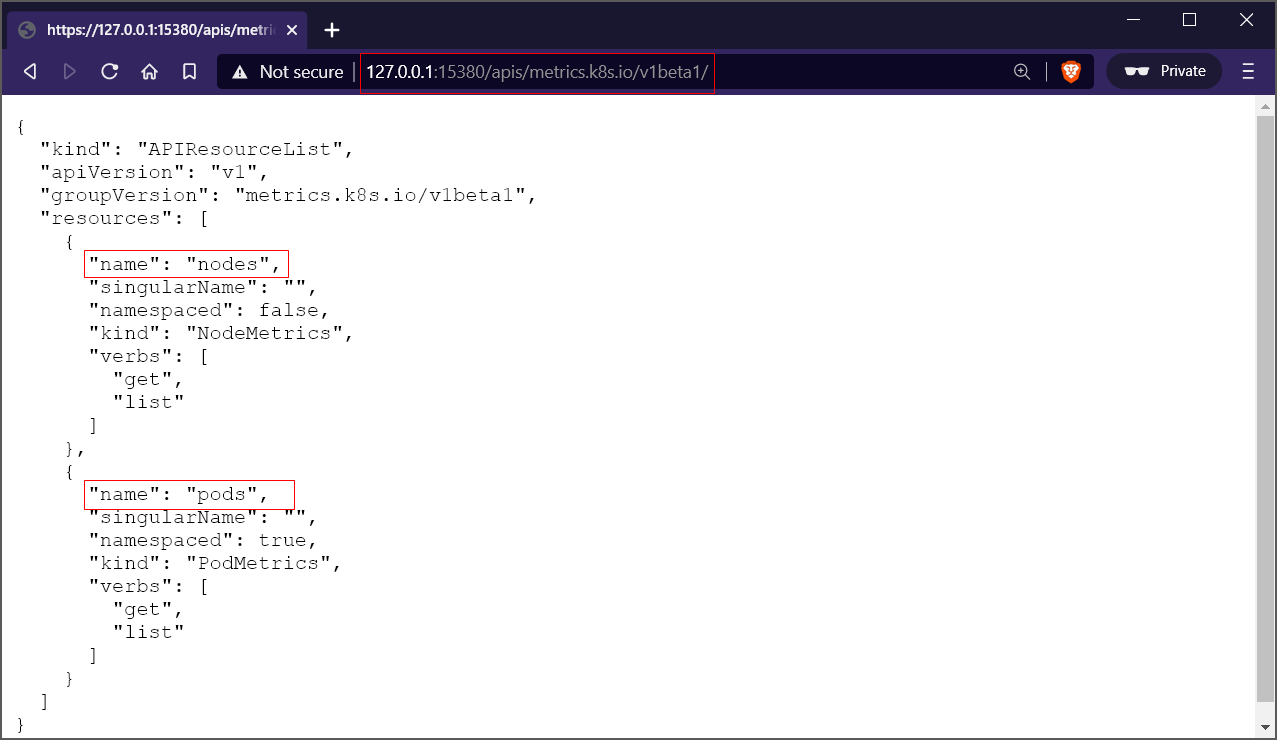
To view the metrics snapshot of all nodes of the cluster, execute the following command:
kubectl get --raw /apis/metrics.k8s.io/v1beta1/nodes | jq '.'
Following is the output of the command from my terminal:
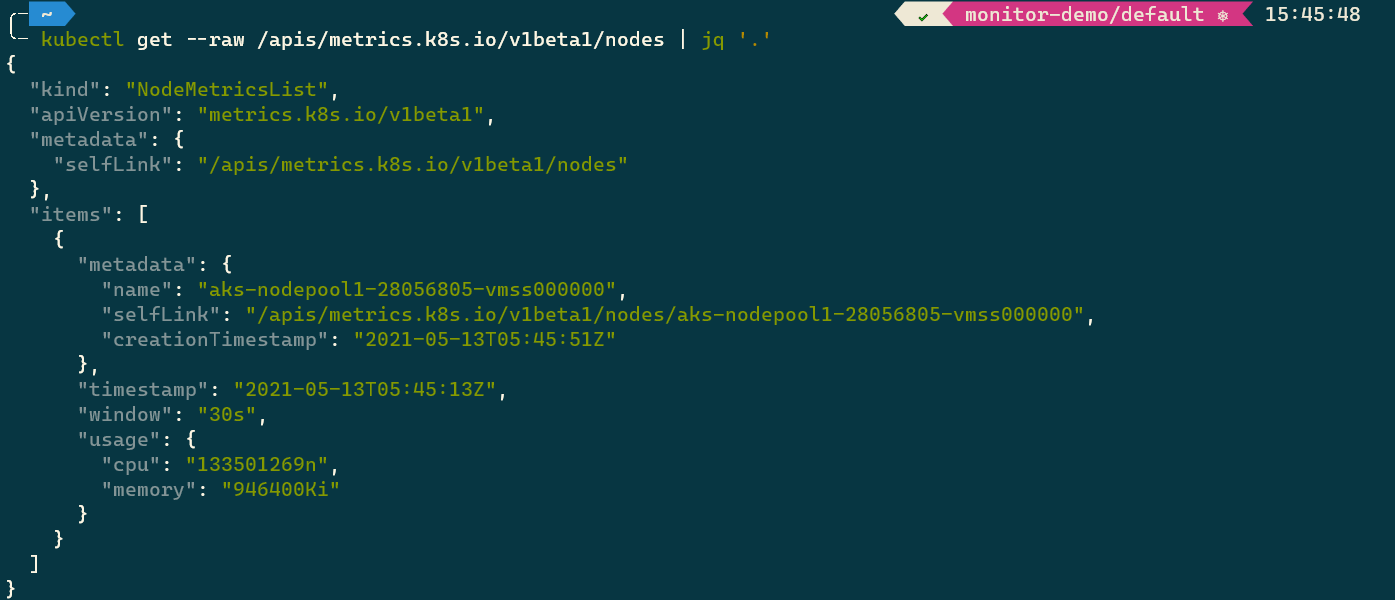
To narrow down your request to a single node, send a GET request to the /apis/metrics.k8s.io/v1beta1/nodes/<node name> endpoint.
Monitoring Pods
You can query the metrics of all pods or a specific pod by sending a GET request to the /apis/metrics.k8s.io/v1beta1/pods endpoint and the /apis/metrics.k8s.io/v1beta1/pods/<pod name> endpoint, respectively as follows:
kubectl get --raw /apis/metrics.k8s.io/v1beta1/pods | jq '.'
Following is the truncated output of the command from my terminal:
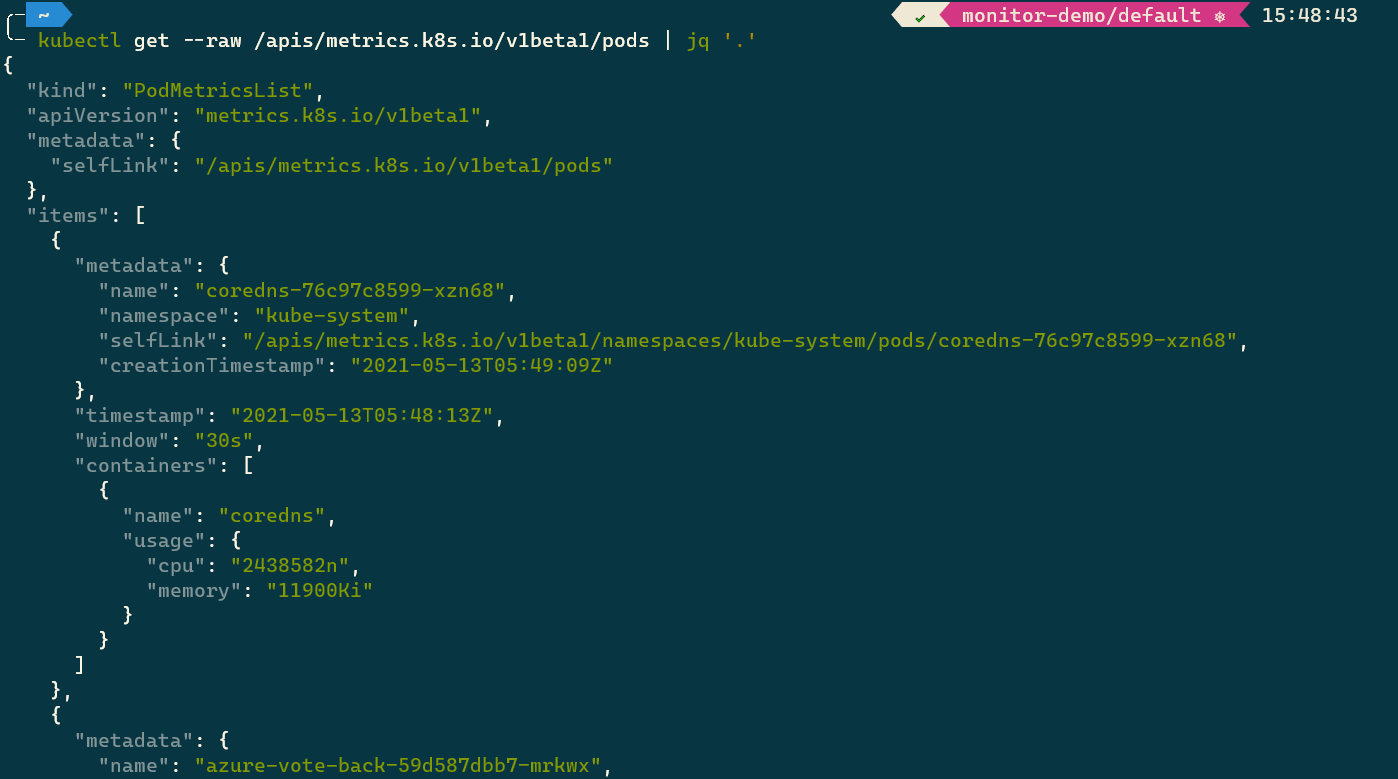
If a pod consists of multiple containers, the API response will include resource statistics for each container. You can use the following command to target the request to a single pod.
kubectl get --raw /apis/metrics.k8s.io/v1beta1/namespaces/default/pods/<pod name>
Kubernetes CLI: kubectl top
Interacting with the raw Metrics API is not very user-friendly. Enter the kubectl top command. The Kubernetes CLI command, kubectl top, allows you to see the resource consumption of all nodes and pods or a specific node and pod. Let’s inspect the resource consumption statistics of our pods by executing the following commands:
kubectl top node
kubectl top pods --all-namespaces
Following is the output of the command:

Monitoring Containers
To inspect the resources consumed by the containers in a pod, add the flag --container to the top command as follows:
kubectl top pods --all-namespaces --containers
Tip: To understand the usage of a Kubernetes CLI command, use the command
kubectl help <command name>to save time. For example, to understand the application of thetopcommand, execute the command:kubectl help top.
Inside Containers with top
To peek inside your containers for monitoring the processes running inside them, we can use the popular Linux command: top. The top command allows you to monitor the processes and their resource usage on Linux, and it is installed by default on every Linux distro. Our plan to peek inside the containers of a pod is straightforward. We will get a shell to a running container and run the top command in the non-interactive mode in it as follows:
kubectl exec <pod name> -- top -bn1
Since we deployed our sample application, Azure Vote App, in the default namespace, we’ll execute the following command that runs the top command for each pod of the application:
kubectl get pods -n default -o custom-columns=name:metadata.name --no-headers | xargs -I{} sh -c 'echo {}; kubectl exec {} -- top -bn1'
Following is the output of the command from my terminal:
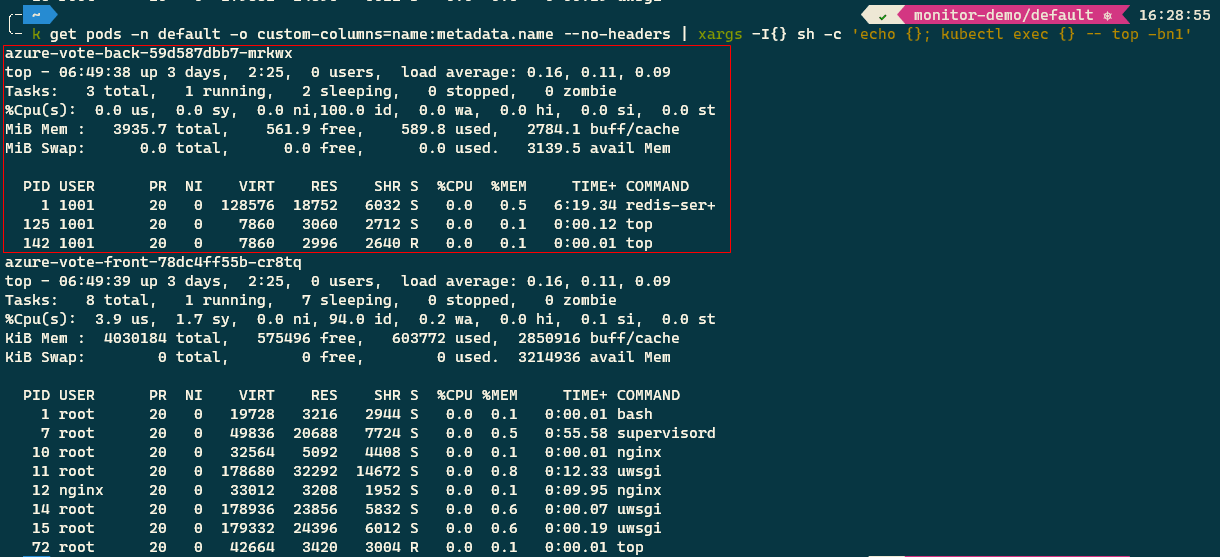
The command output displays:
- System time, uptime, and user sessions.
- Memory used: RAM and Swap (part of the disk that is used like RAM).
- Processes running in the container.
- CPU usage in terms of CPU time spent on the various processes.
- Average load over one, five, and fifteen minutes.
- Task display that includes: Process ID, User who started the process, Nice value, Priority, Memory consumption, State of the process, CPU time, and the name of the process.
Monitoring Kubernetes State
Kube-state-metrics is a service that listens to the Kubernetes API server and generates metrics about the state of the objects such as deployments, nodes, and pods. The kube-state-metrics service does not persist data and only has a metrics endpoint that serves the latest data points of the requested object. You can use tools such as Prometheus to scrape the service endpoint and persist the data in permanent storage.
You can read more about the kube-state-metrics service and guidance on installation and usage in its documentation on GitHub. Remember that kube-state-metrics is not a replacement for the Metrics Server. The Metrics Server helps you monitor the CPU and memory usage of cluster nodes and pods. On the other hand, the kube-state-metrics service allows you to monitor the state of your cluster by serving information about the count, health, and availability of pods, nodes, and other Kubernetes objects.
Summary
In this article, we learned to install the Metrics Server to our cluster and explored the commands to monitor resources at various levels: Node, Pod, and Container. We also learned to use the Linux top command to analyze the resources used by the processes within a container. Finally, we discussed the kubernetes-state-metrics service, which monitors the state of the Kubernetes objects, and touched on a few key differences between the service and the Metrics Server.
If you liked the article, and are keen on reading nuggets of information about Kubernetes, Cloud, and career development, follow me on Twitter @rahulrai_in. Please post your questions and suggestions in the comments section below.
Did you enjoy reading this article? I can notify you the next time I publish on this blog... ✍